Noise is not perception: real measurements from Austria to Hong Kong with Altruist Urban
Is the noise around us really what we think it is? To find out, I took an Altruist Urban sensor and started measuring…
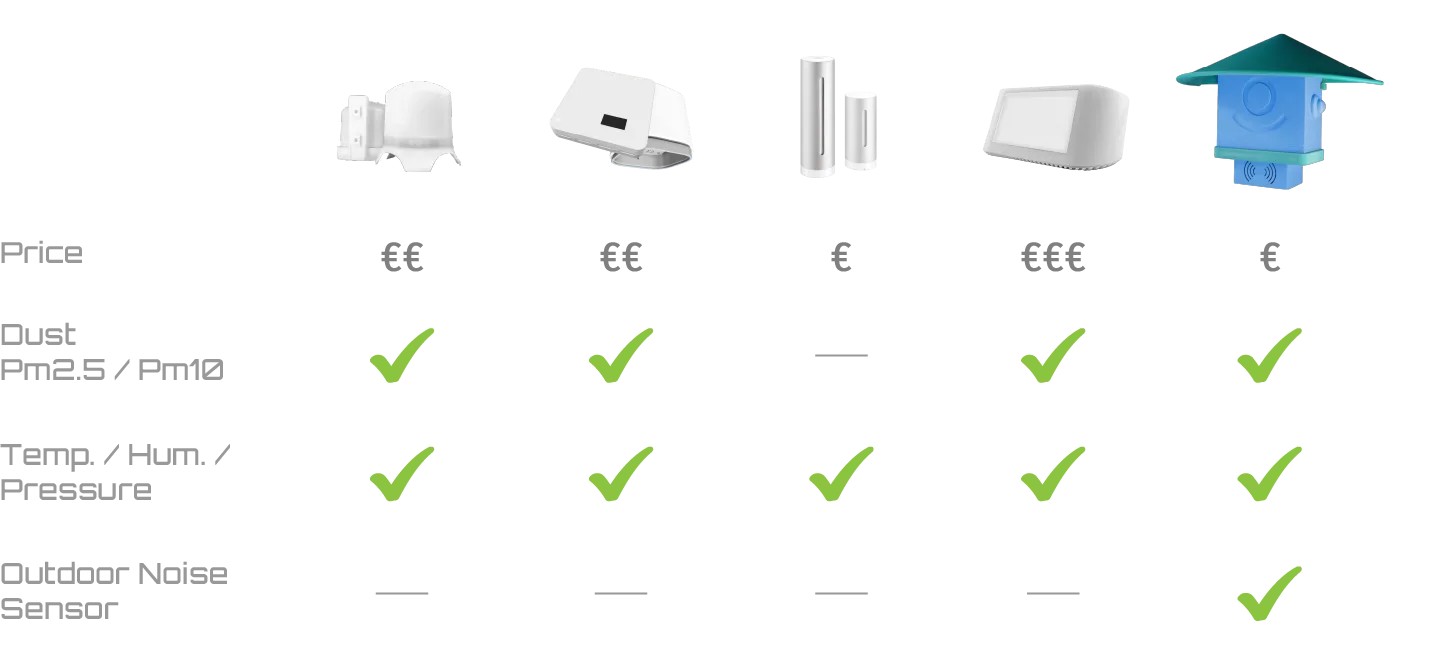
Altruist Urban is a sensor designed to measure environmental parameters.
On par with leading air quality monitors such as PurpleAir Zen, AirGradient, Netatmo, and AirVisual Pro, it provides accurate measurements of particulate pollution, temperature, humidity, and atmospheric pressure.
However, its key differentiator is a built-in urban noise sensor (30–120 dB).
This makes it possible to analyze the environment more comprehensively — not only through air quality, but also through acoustic impact.
From a quiet Austrian village to noisy festivals
It all started in a very quiet place in the summer of 2025.
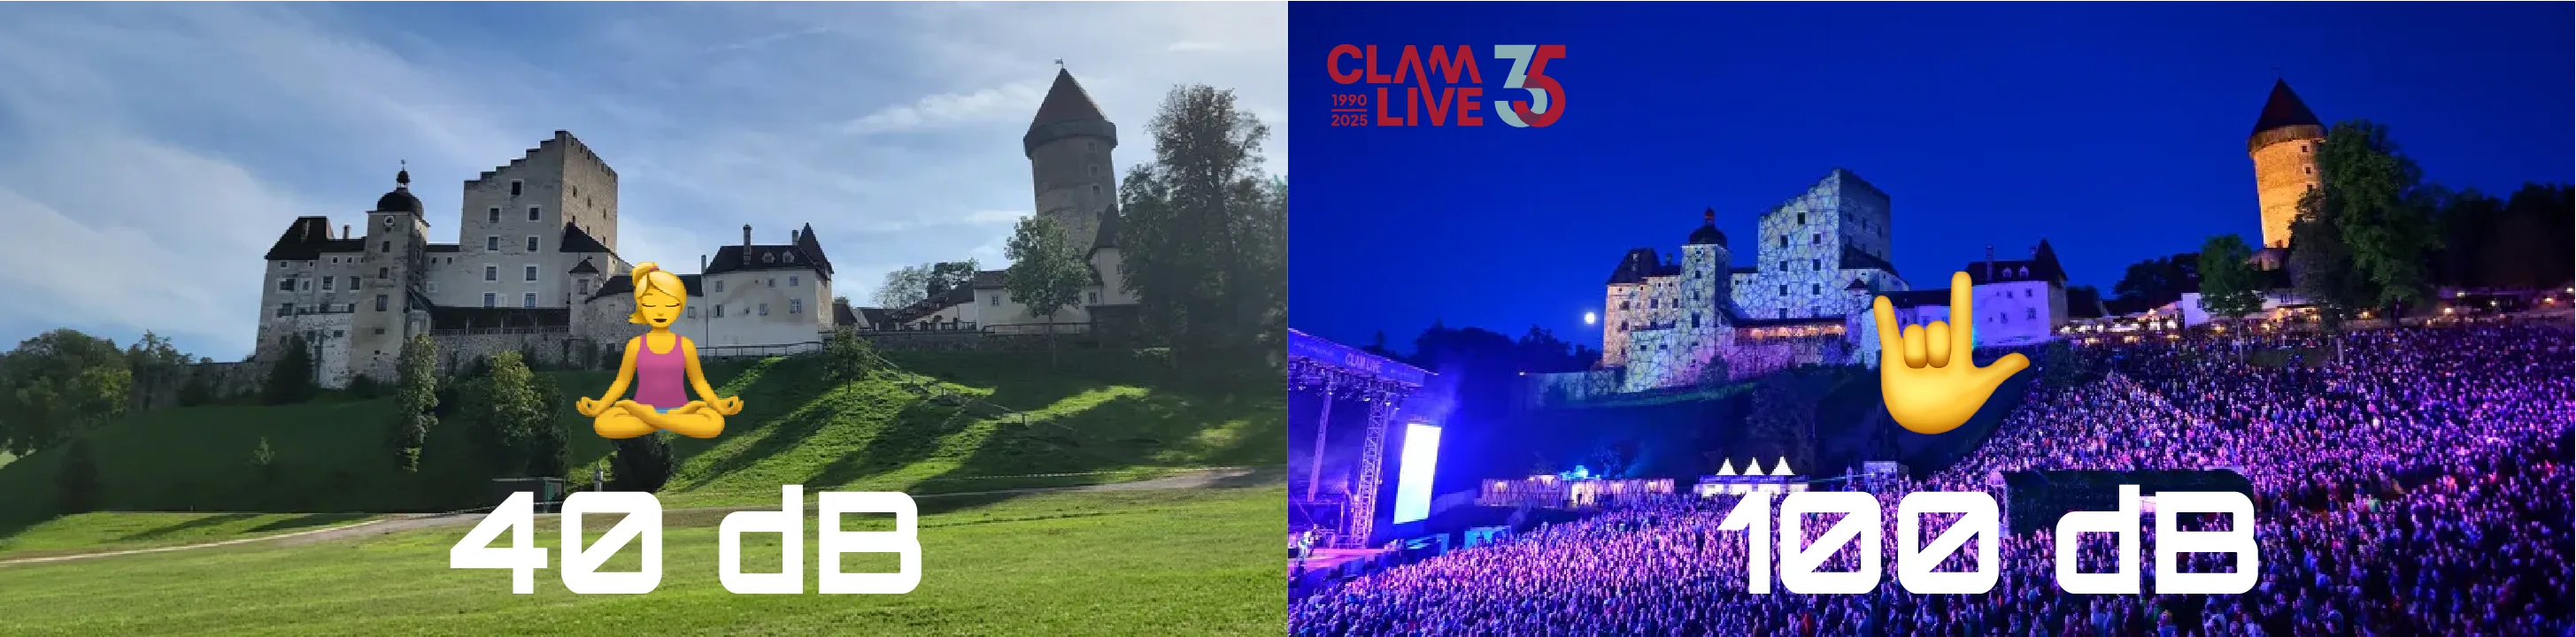
I was living near Burg Clam in Austria — a small, peaceful village on a hill, where you usually hear nothing but wind and nature. But every summer, everything changes: the silence gives way to a large open-air concert venue with world-famous artists, along with a huge influx of visitors and cars.
Hollywood Vampires with Johnny Depp, Elton John, Alice Cooper, Sting, Bryan Adams, The Offspring, Zucchero, Simply Red, Lenny Kravitz and many others take the stage here.
And, as often happens, local residents began to complain about noise from the concerts and visitors, saying it disrupted the village’s nighttime peace. I decided to test this using real measurements and data, with an Altruist Urban sensor in hand.
🎤 Experiment: concert vs. village

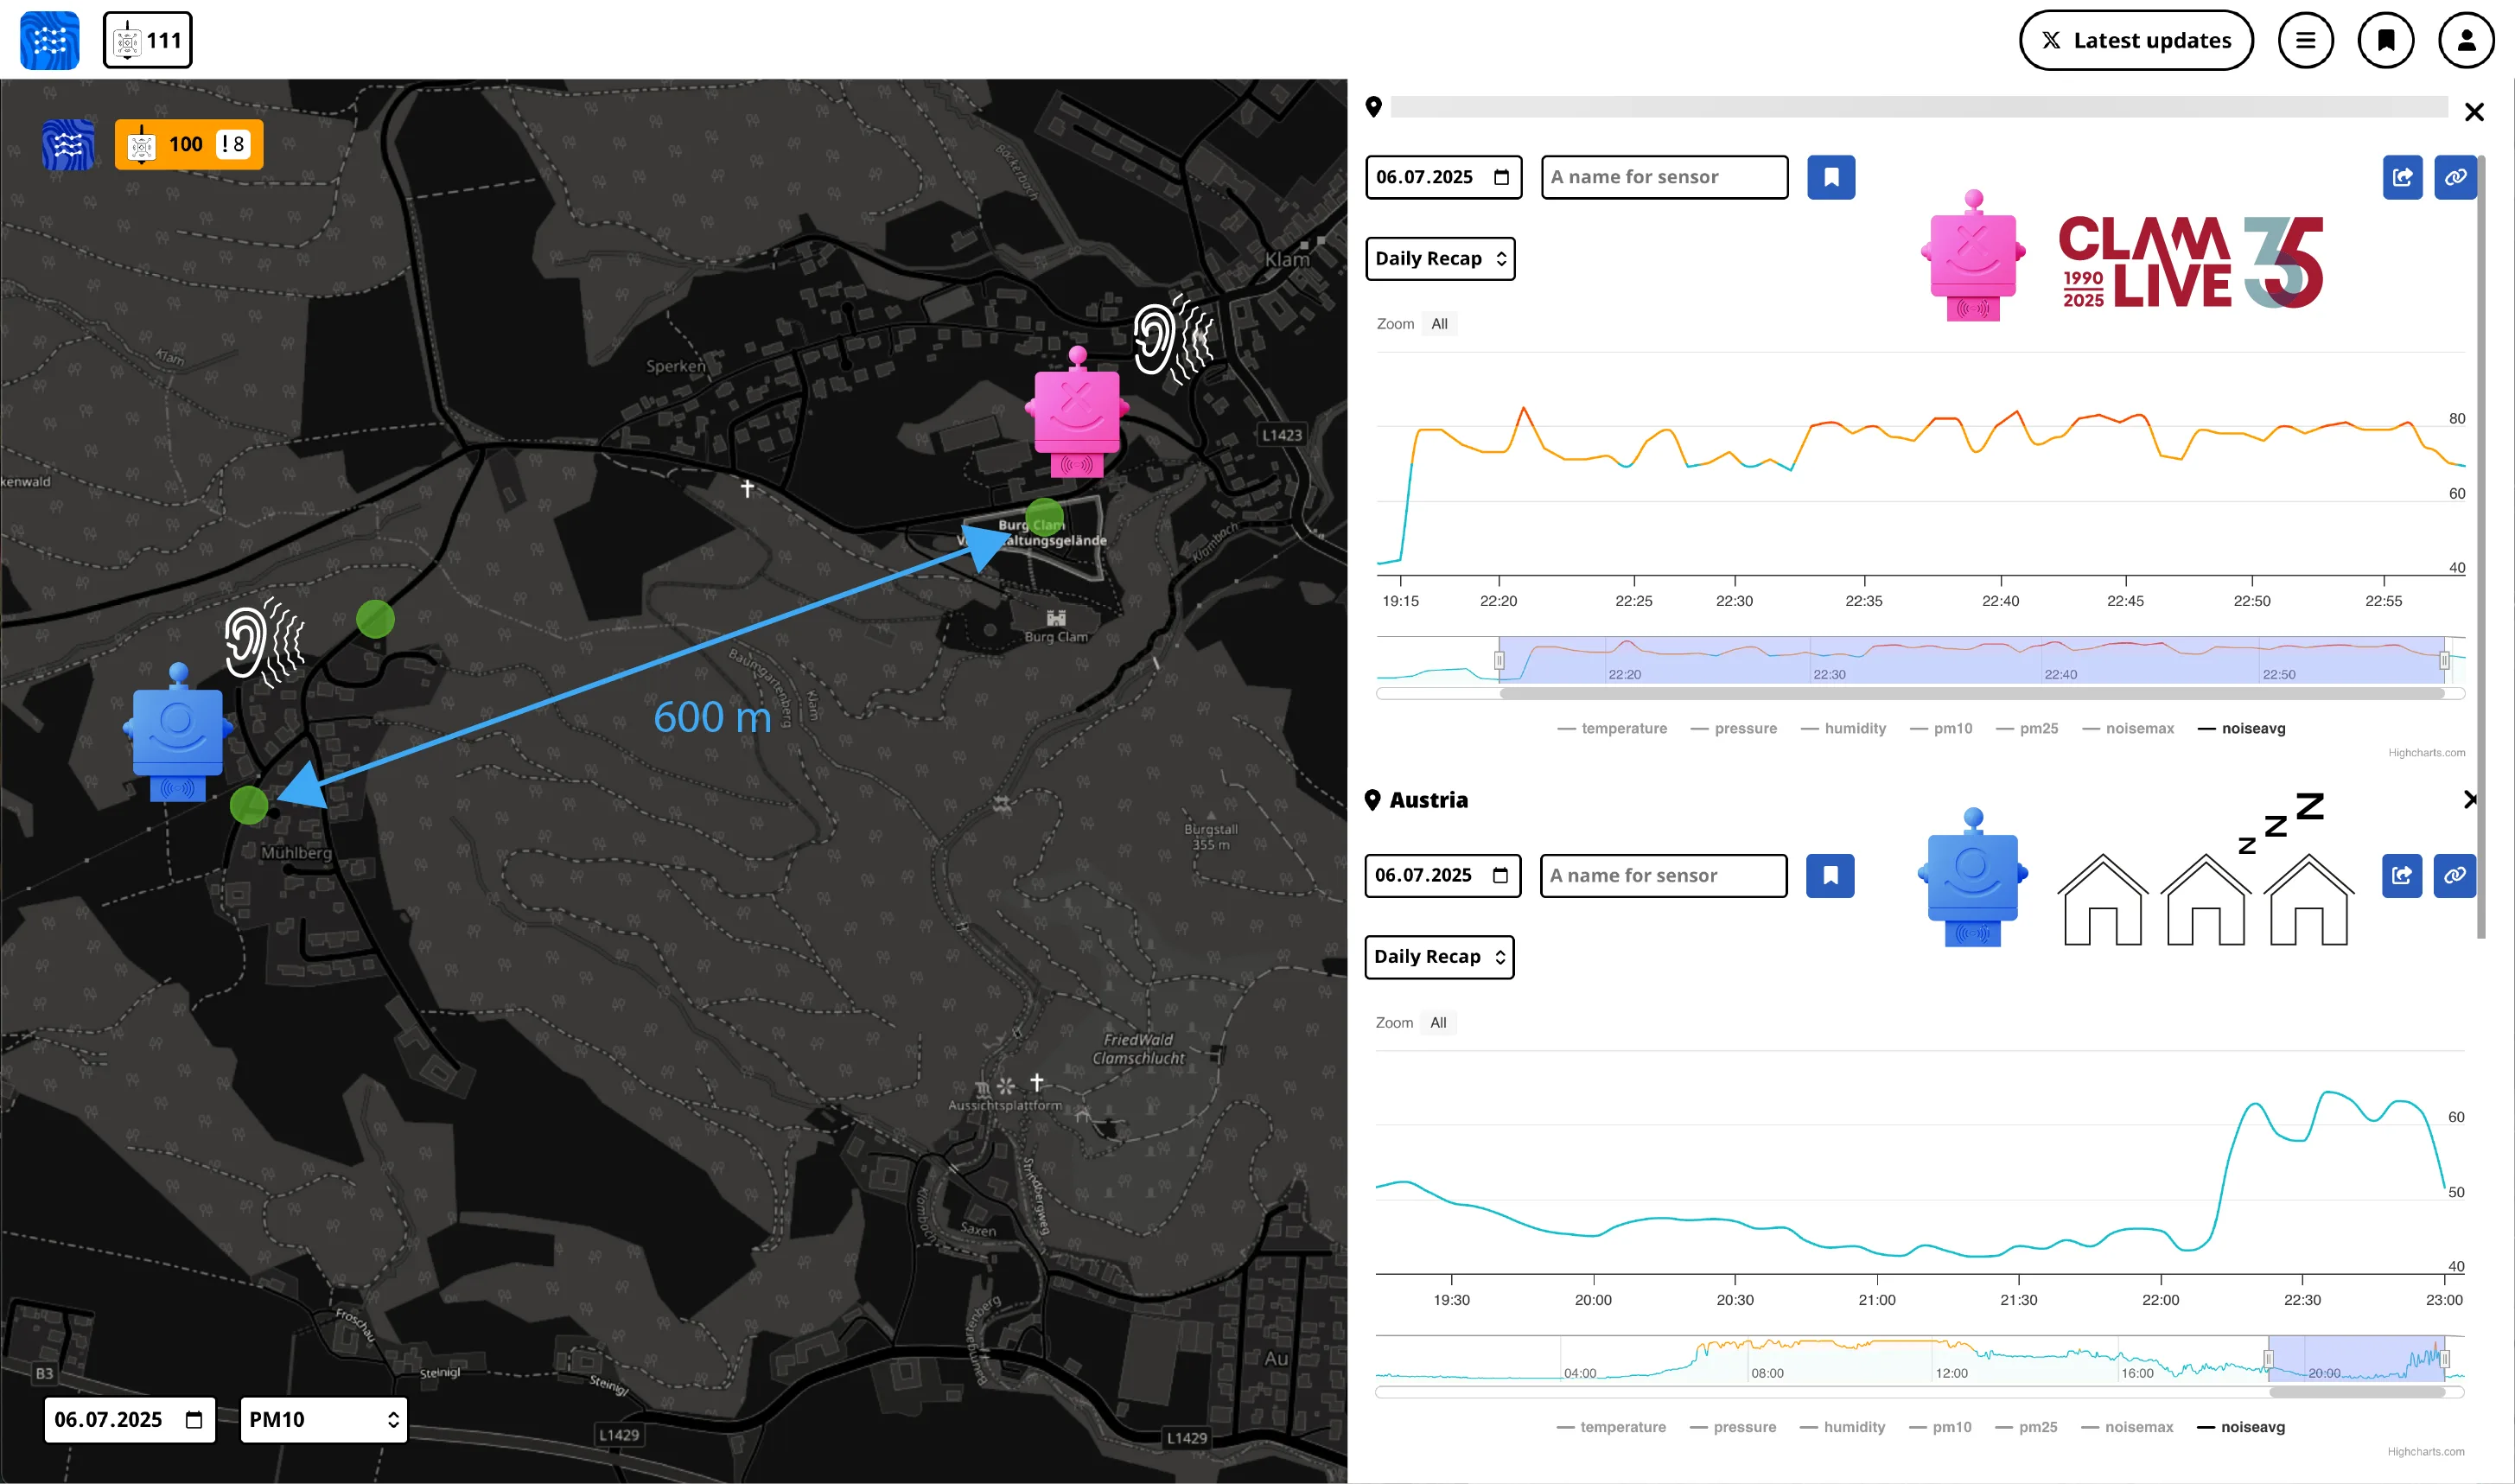
I used two Altruist devices:
- One was left at home in the village, about 600 meters from the concert venue.
- The second one I took with me to the concert.
I measured how far the noise from the concert and the flow of visitors at night spreads to the residential area, and how critical it actually is for local residents.
Result
- The noise level in my residential area at night remained moderate, with a maximum of 62 dB, and was not perceived as disruptive to comfortable rest, while at the concert venue it reached up to 85 dB.
- The sound from the concert did not have a significant impact on the nighttime quiet of the nearby residential area within walking distance; in fact, its echoes created a pleasant background. (Wouldn’t it be nice if Sting were singing live in your bedroom before sleep? ☺️)
Conclusion: Perceived noise ≠ real data
Practical application
For event organizers and city authorities, this is a tool to control noise propagation beyond the event area.
- tracking noise levels in nearby residential zones
- verifying compliance with agreed noise limits based on data
- real-time monitoring
- the ability to respond quickly if noise exceeds acceptable levels
This makes it possible to manage event acoustics, stay within agreed noise regulations, and handle residents’ complaints based on objective data.
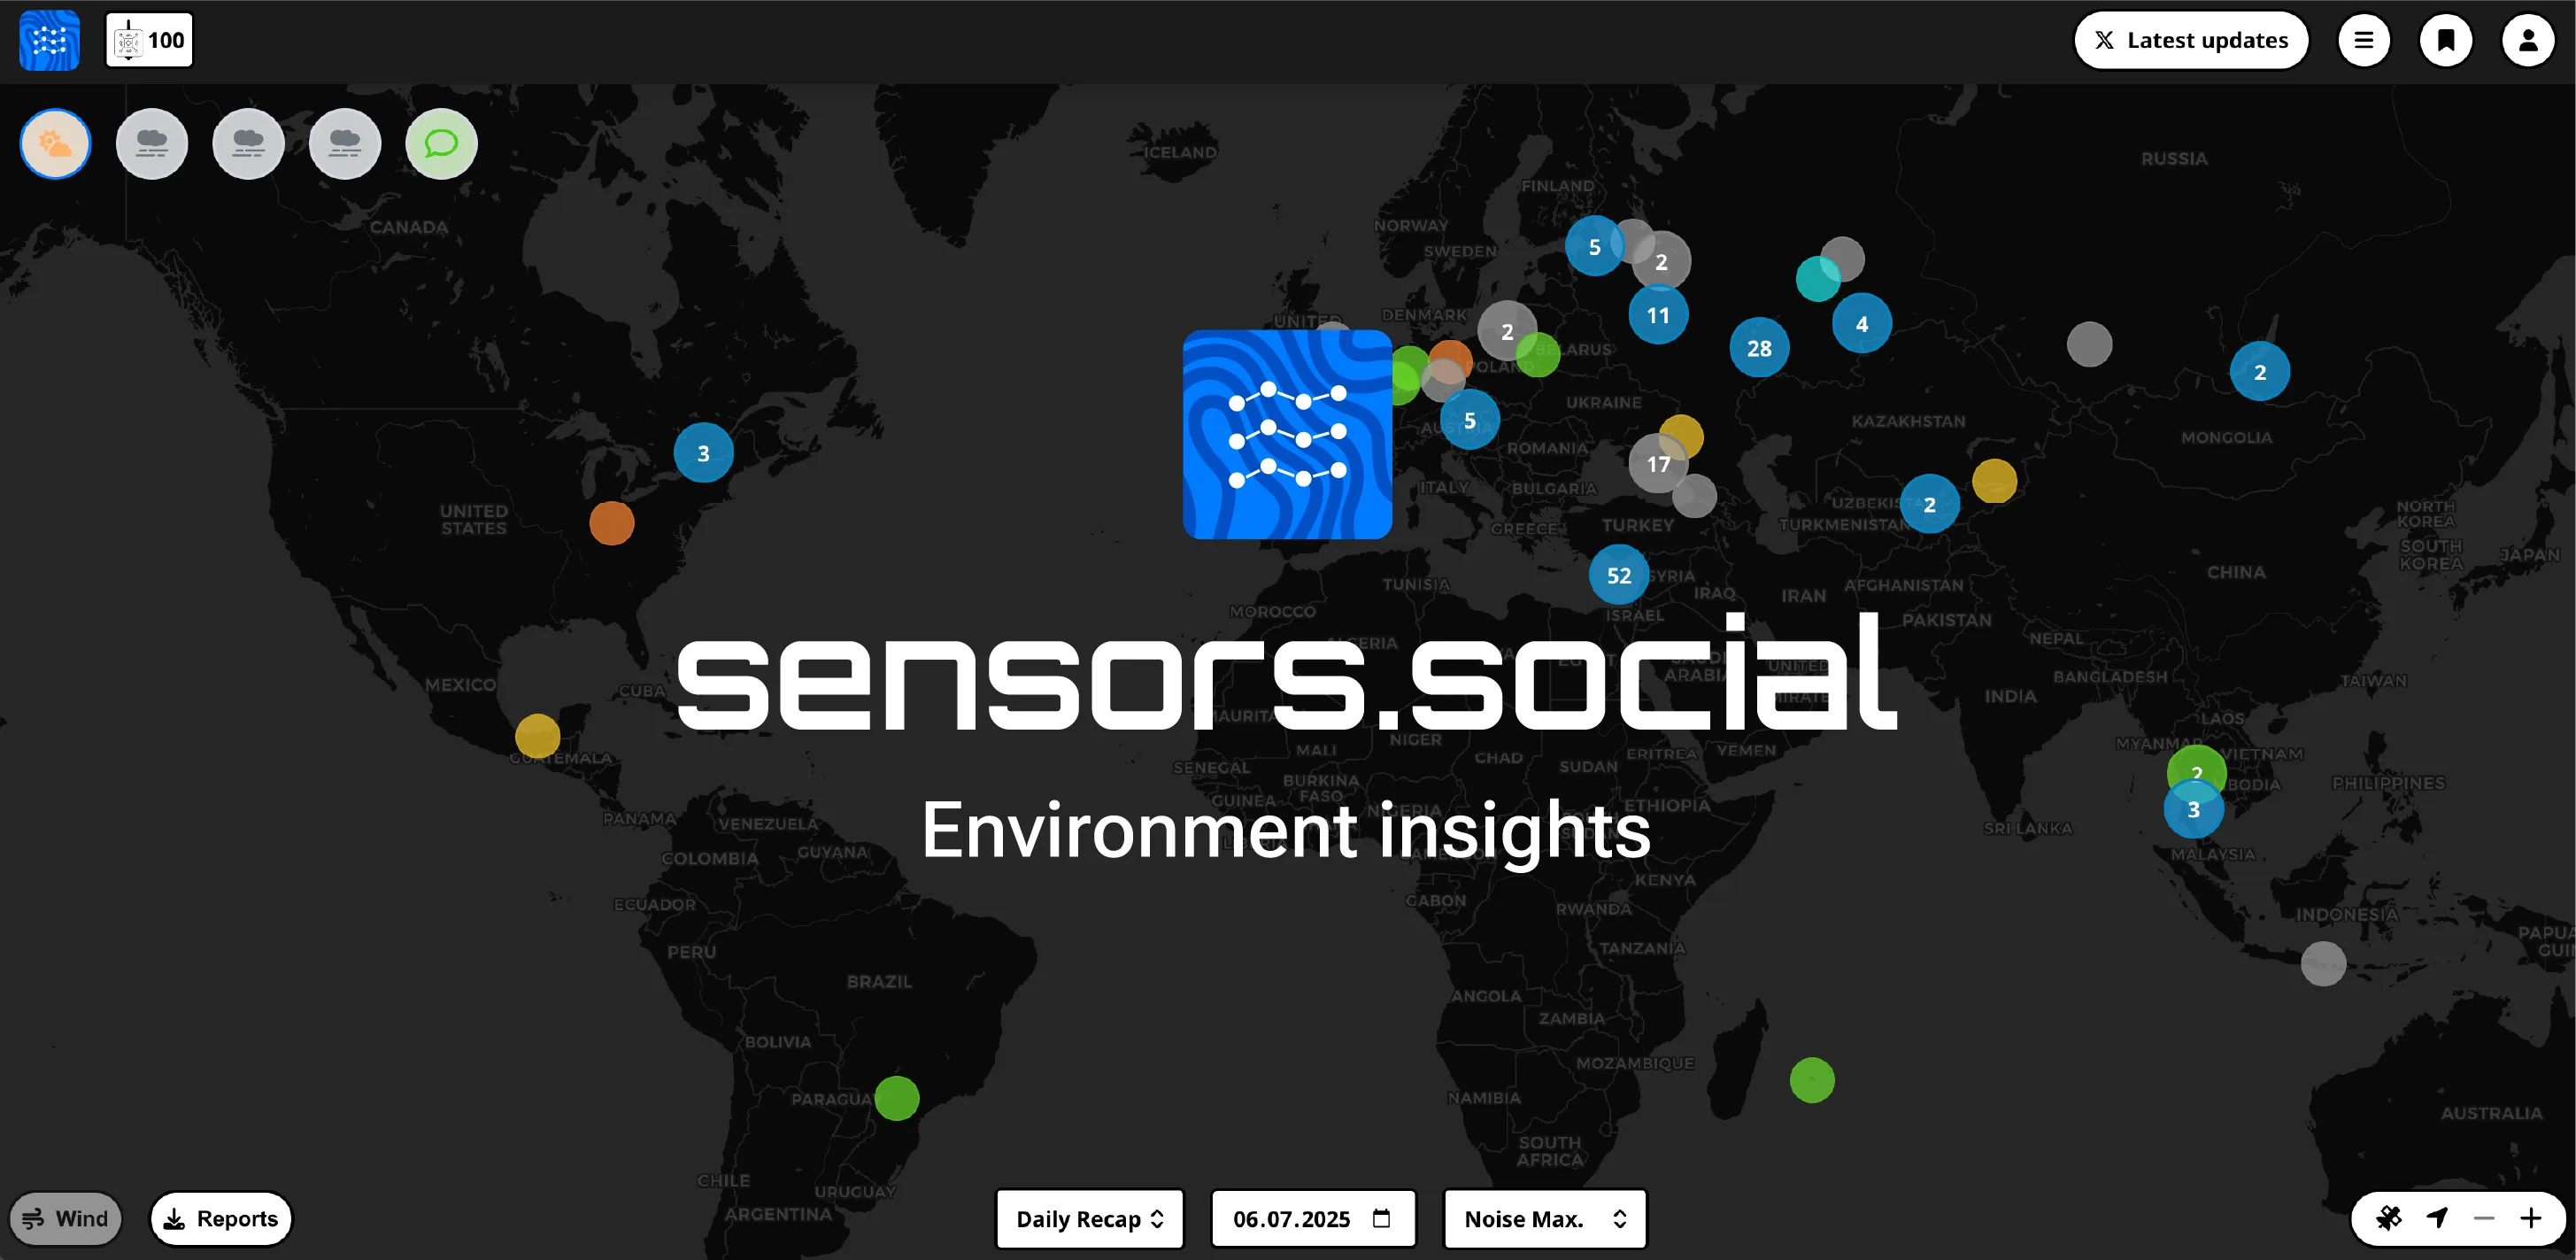
Data can be made publicly available on the open sensor map sensors.social, increasing transparency and helping reduce the number of unfounded complaints from residents.
A tool for transparent interaction between organizers, cities, and residents.
Bonus from concerts: who performs louder?
After getting into noise measurement experiments, I decided to compare data from two performances — partly to test the sensor, and partly out of curiosity. It turned into a very interesting insight and a potential use case for integrations.
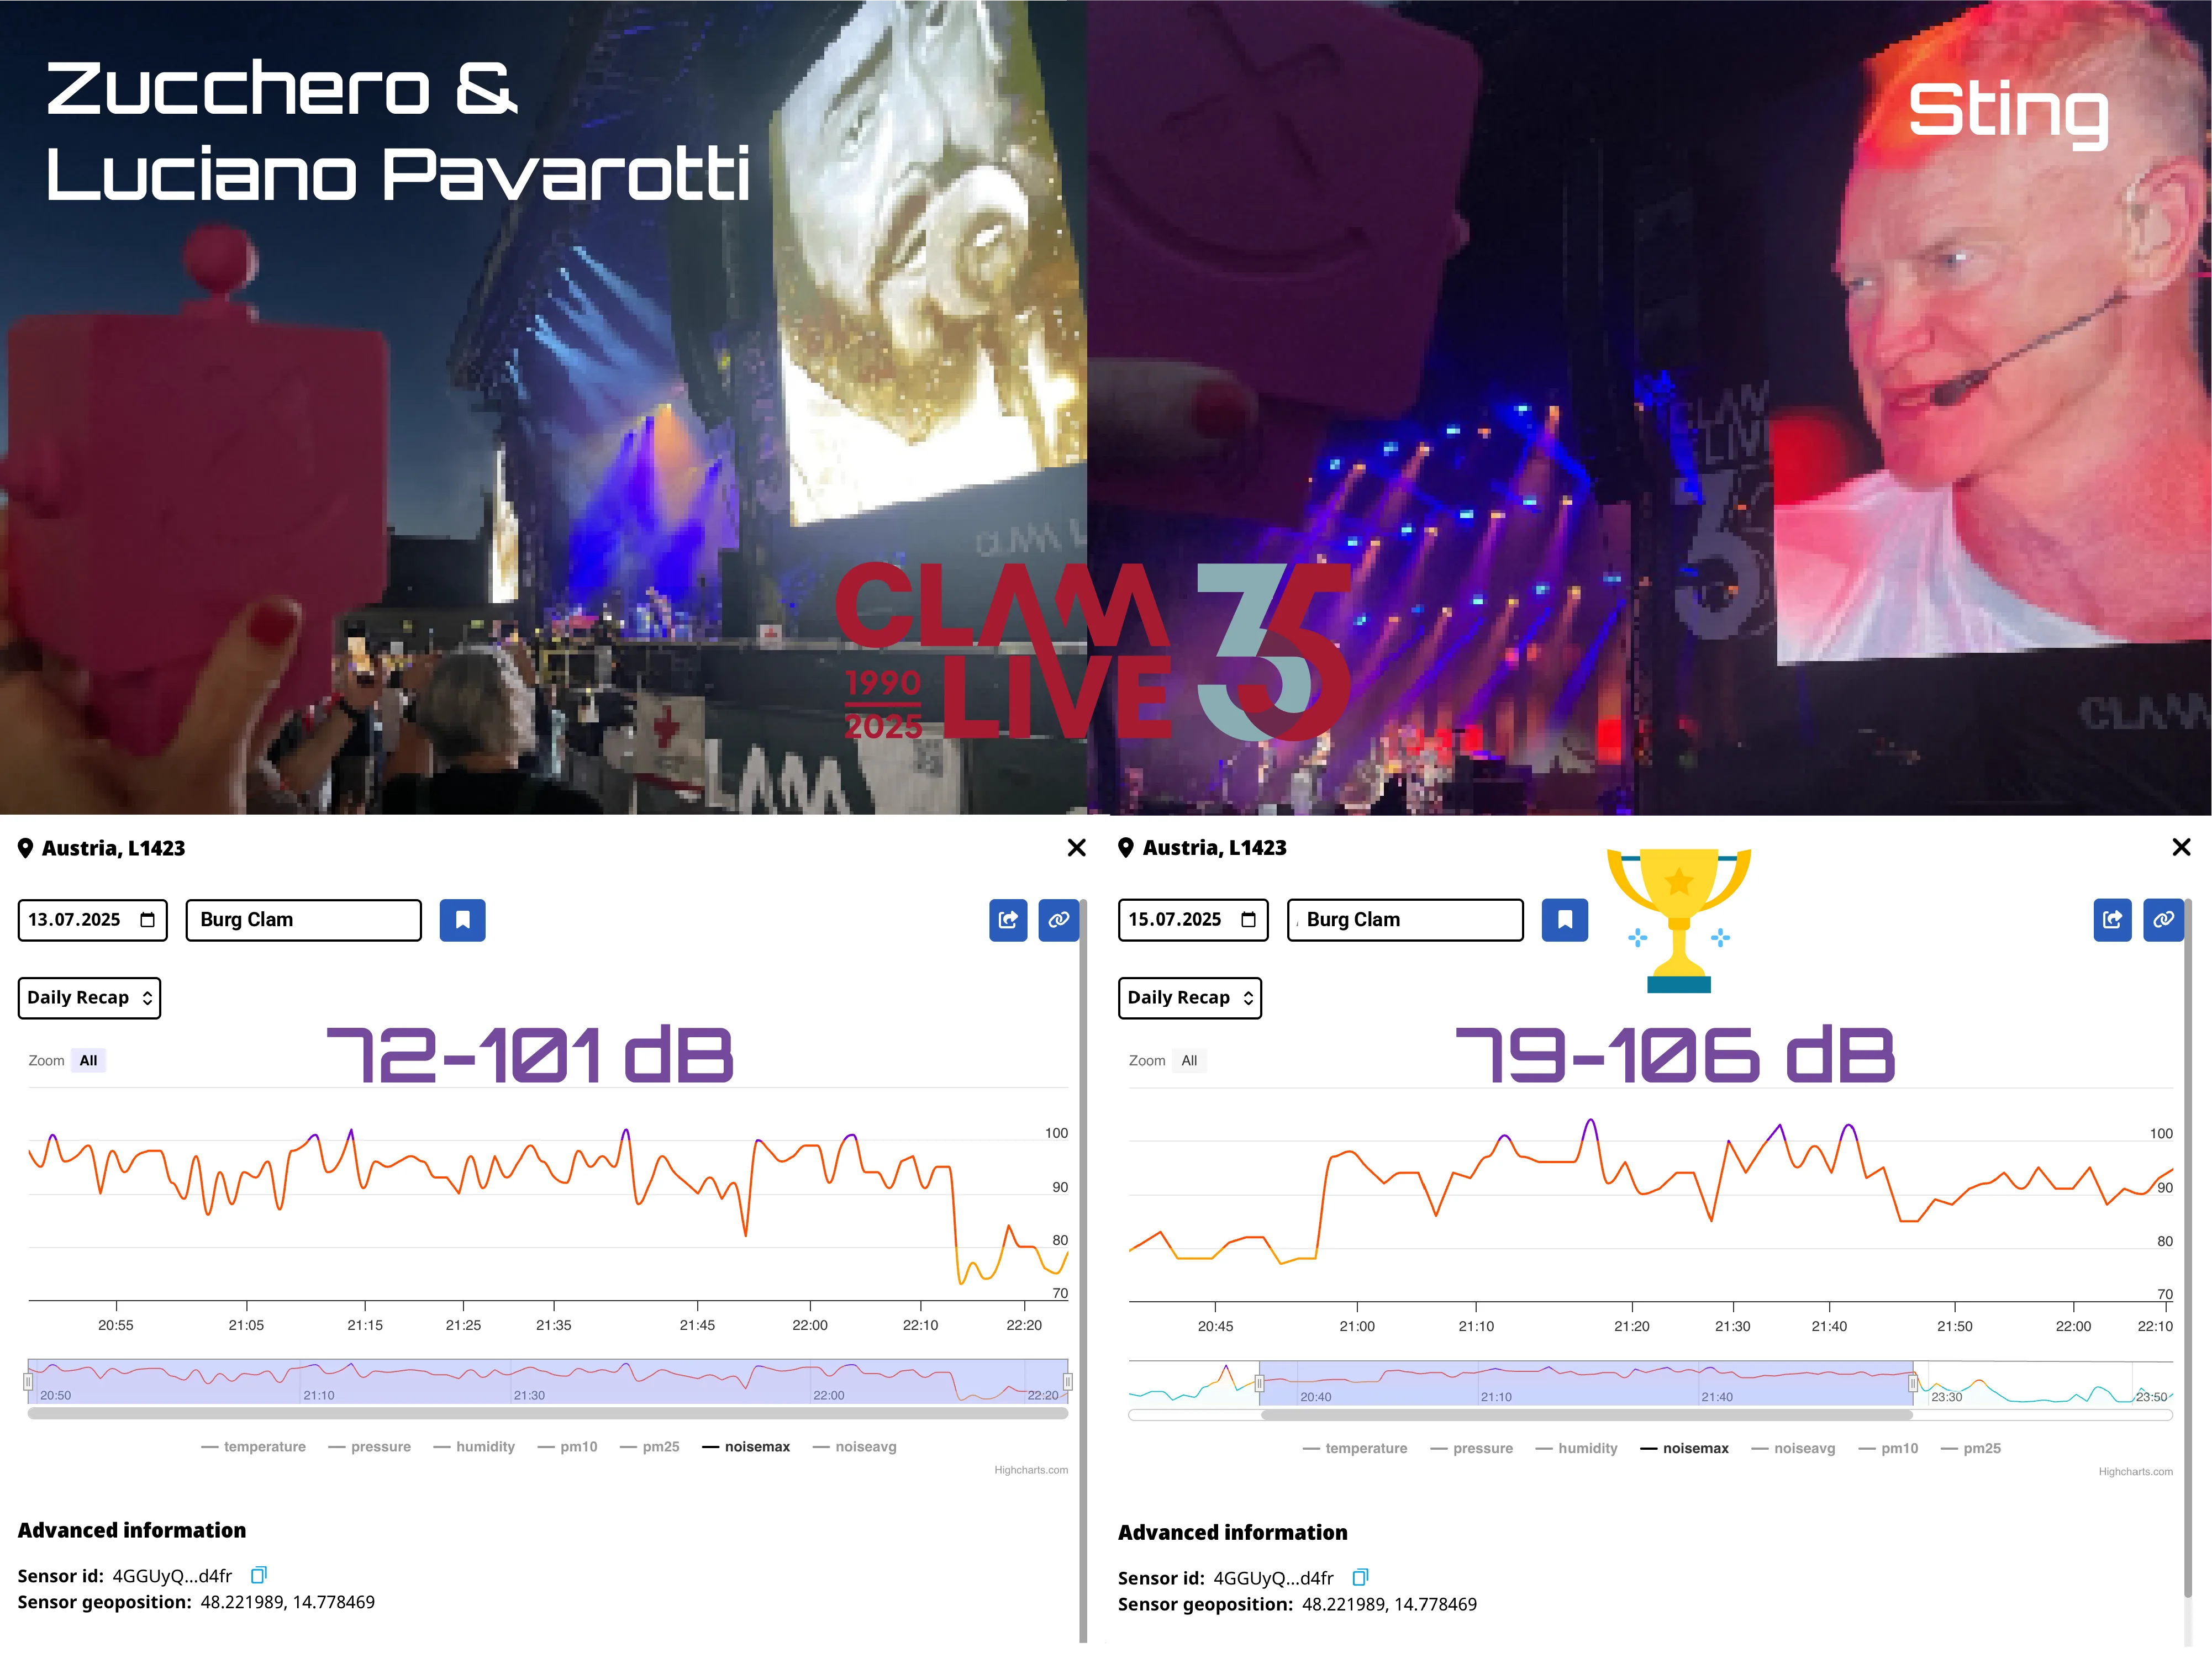
I attended two concerts and compared the noise levels of different artists: Sting vs. Zucchero & Luciano Pavarotti.
I observed how noise dynamics change — the peaks on the sensor graphs fully matched specific moments in the performances, and different genres created distinct acoustic profiles.
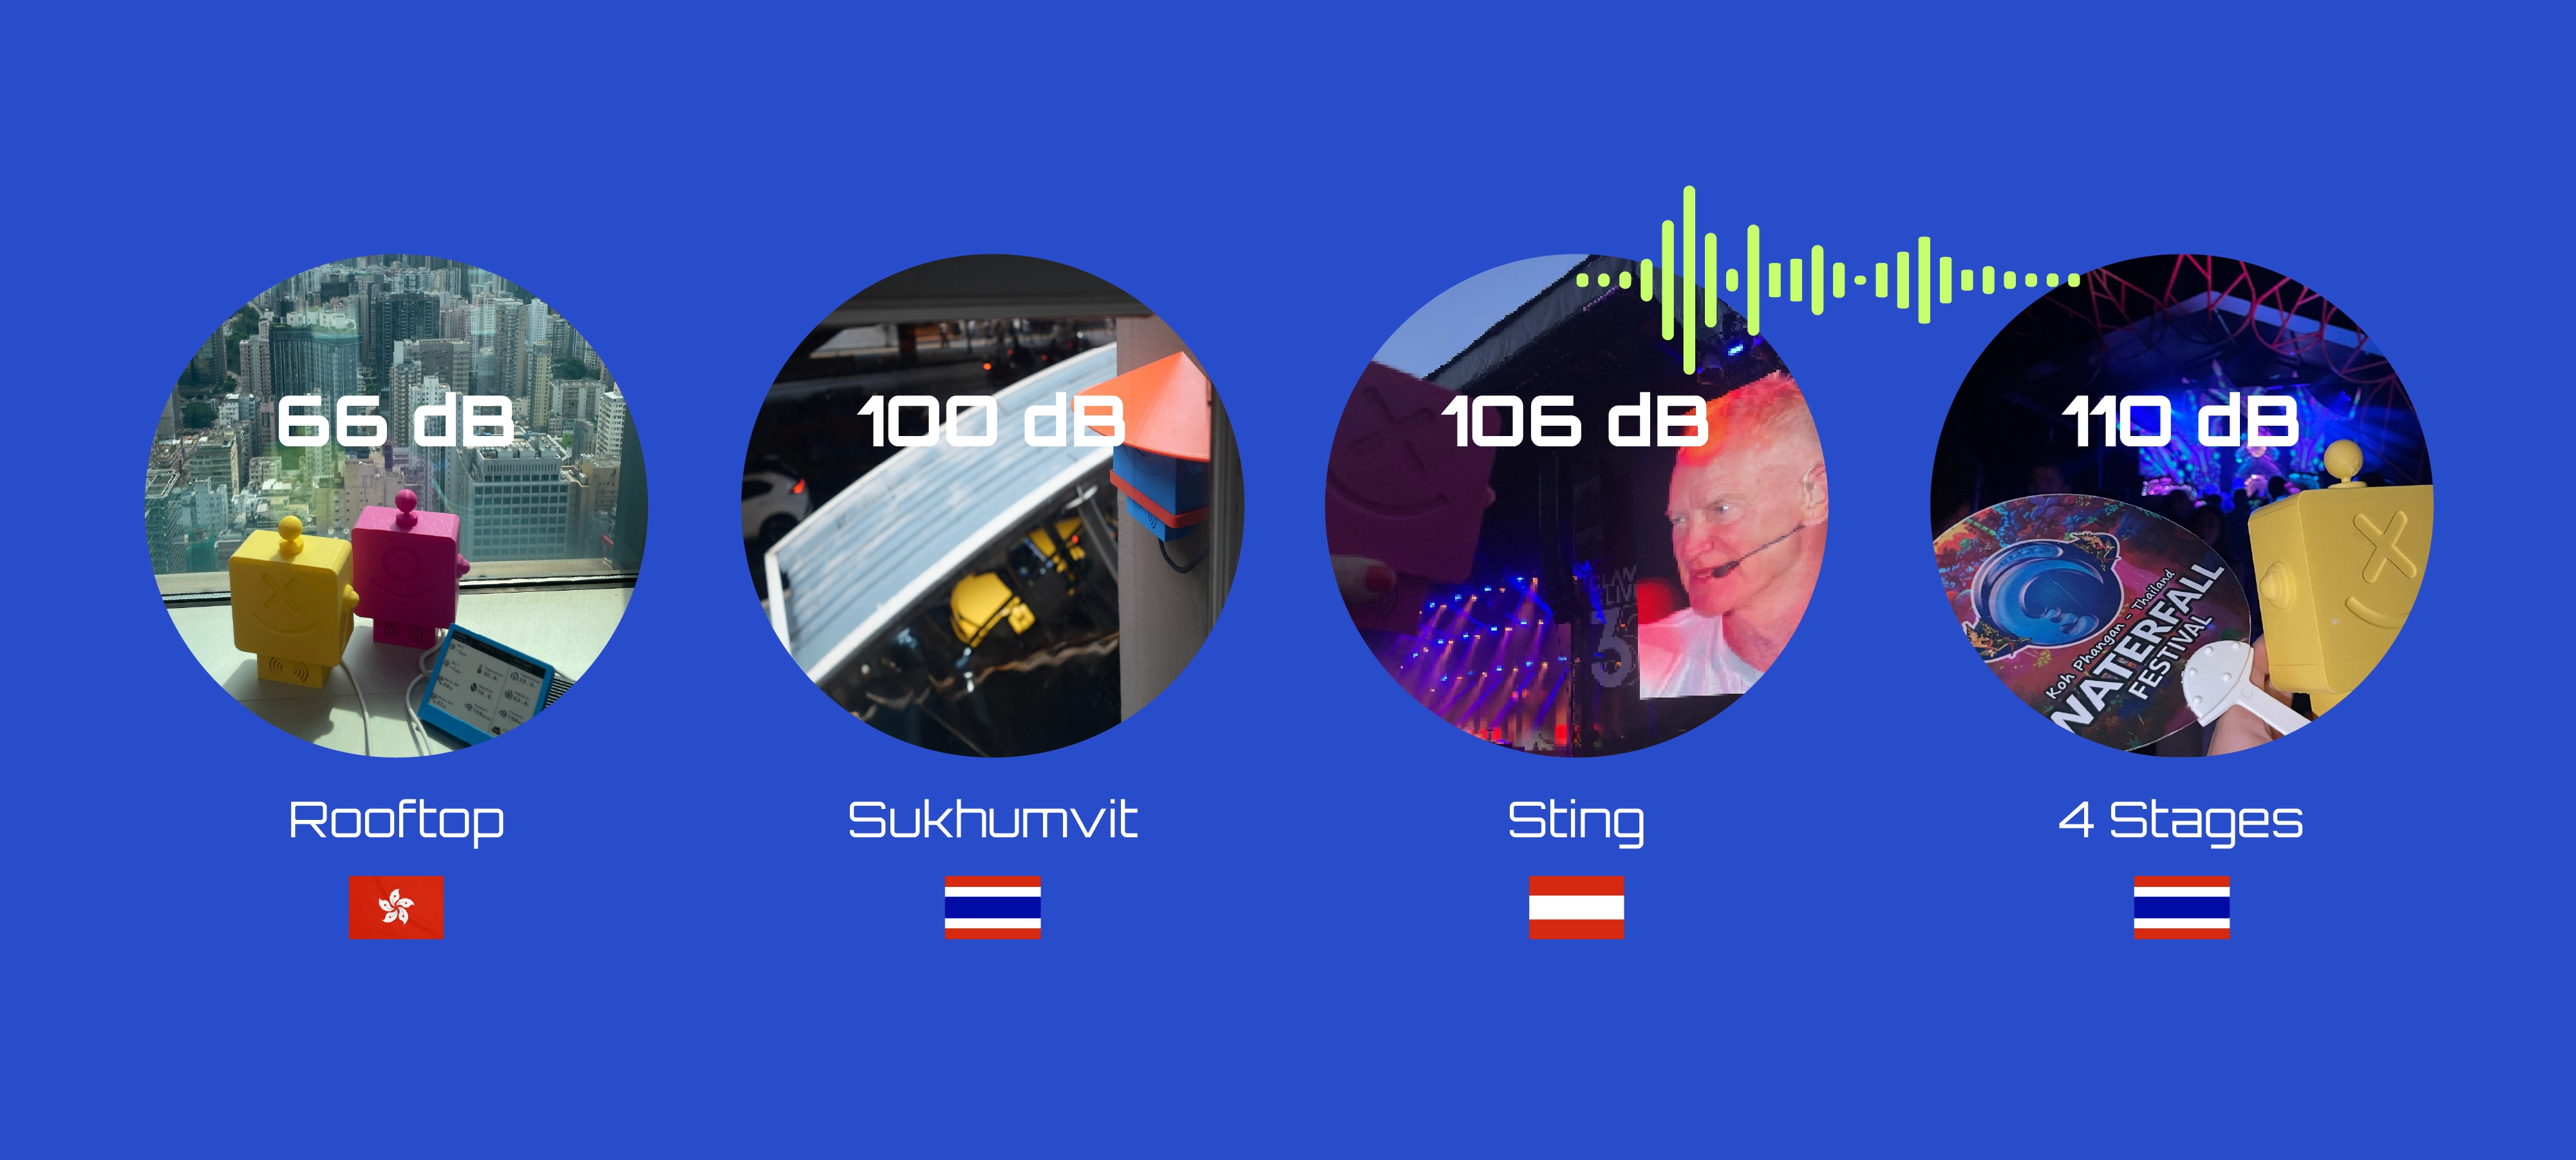
Interestingly, even Sting’s relatively calm genre showed higher peak values — noise levels reached up to 106 dB.
This is no longer just measurement — it’s a tool for analyzing concert acoustics in open-air venues.
Practical application
Useful for event organizers and sound engineers:
- sound tuning and acoustic distribution across the venue
- analysis of noise propagation across different zones
- comparison of performances and acoustic scenarios
- optimization of stage placement and sound system setup
Bangkok city center: Sukhumvit apartments vs. side street apartments
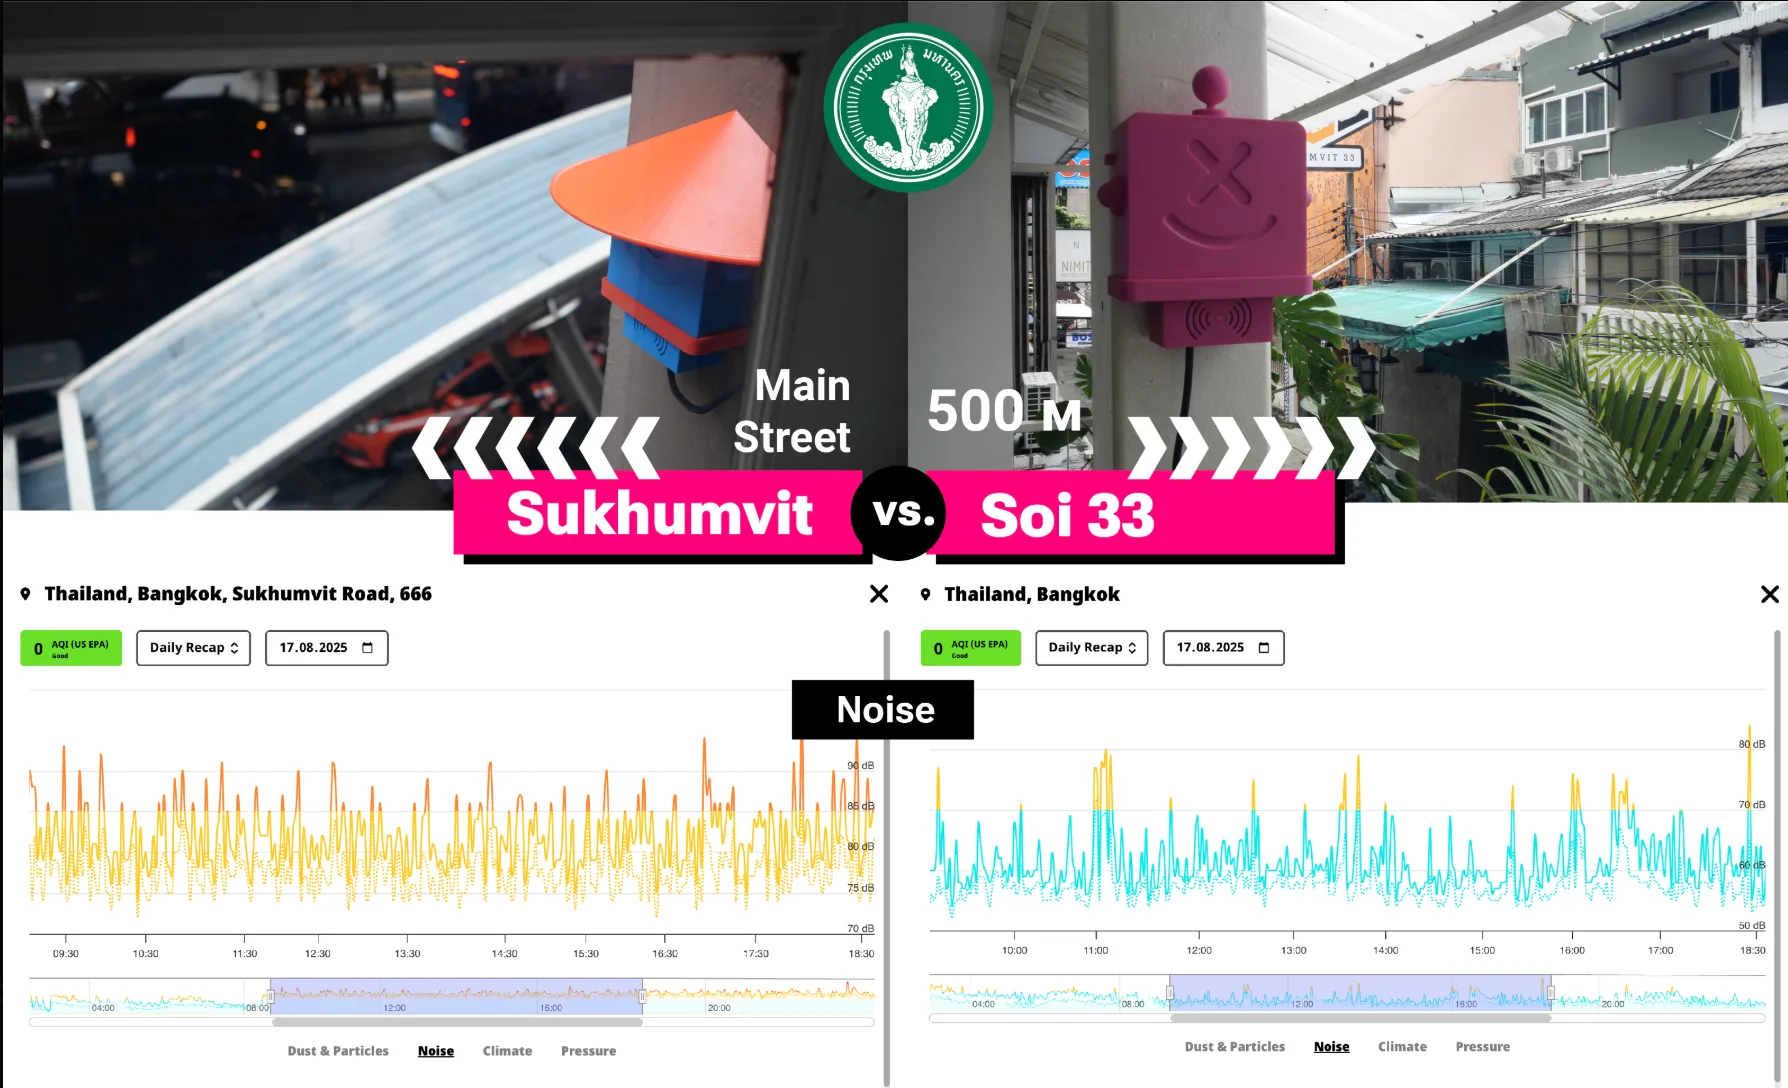
The next test took place on the busy streets of a megacity — Bangkok.
In August 2025, my team and I measured noise levels simultaneously in two apartments to compare conditions. One sensor was placed in an apartment facing Sukhumvit Road — one of Bangkok’s main streets — and the second in an apartment on a nearby side street, about 500 meters away. Measurements were taken throughout the day.
Result
The difference was significant. The side street remained quiet and comfortable despite its proximity to the main road.
Noise levels on Sukhumvit stayed consistently in the 75–95 dB range during the day, while the nearby street averaged 50–70 dB (with occasional spikes from passing motorbikes).
Conclusion: urban environments depend heavily on micro-location, not just the district.
Practical application
This is a valuable use case for short-term rental owners. You can add sensor data to your Airbnb listing and reliably demonstrate the quietness of your area with historical graphs — simply by installing a sensor outside your window.
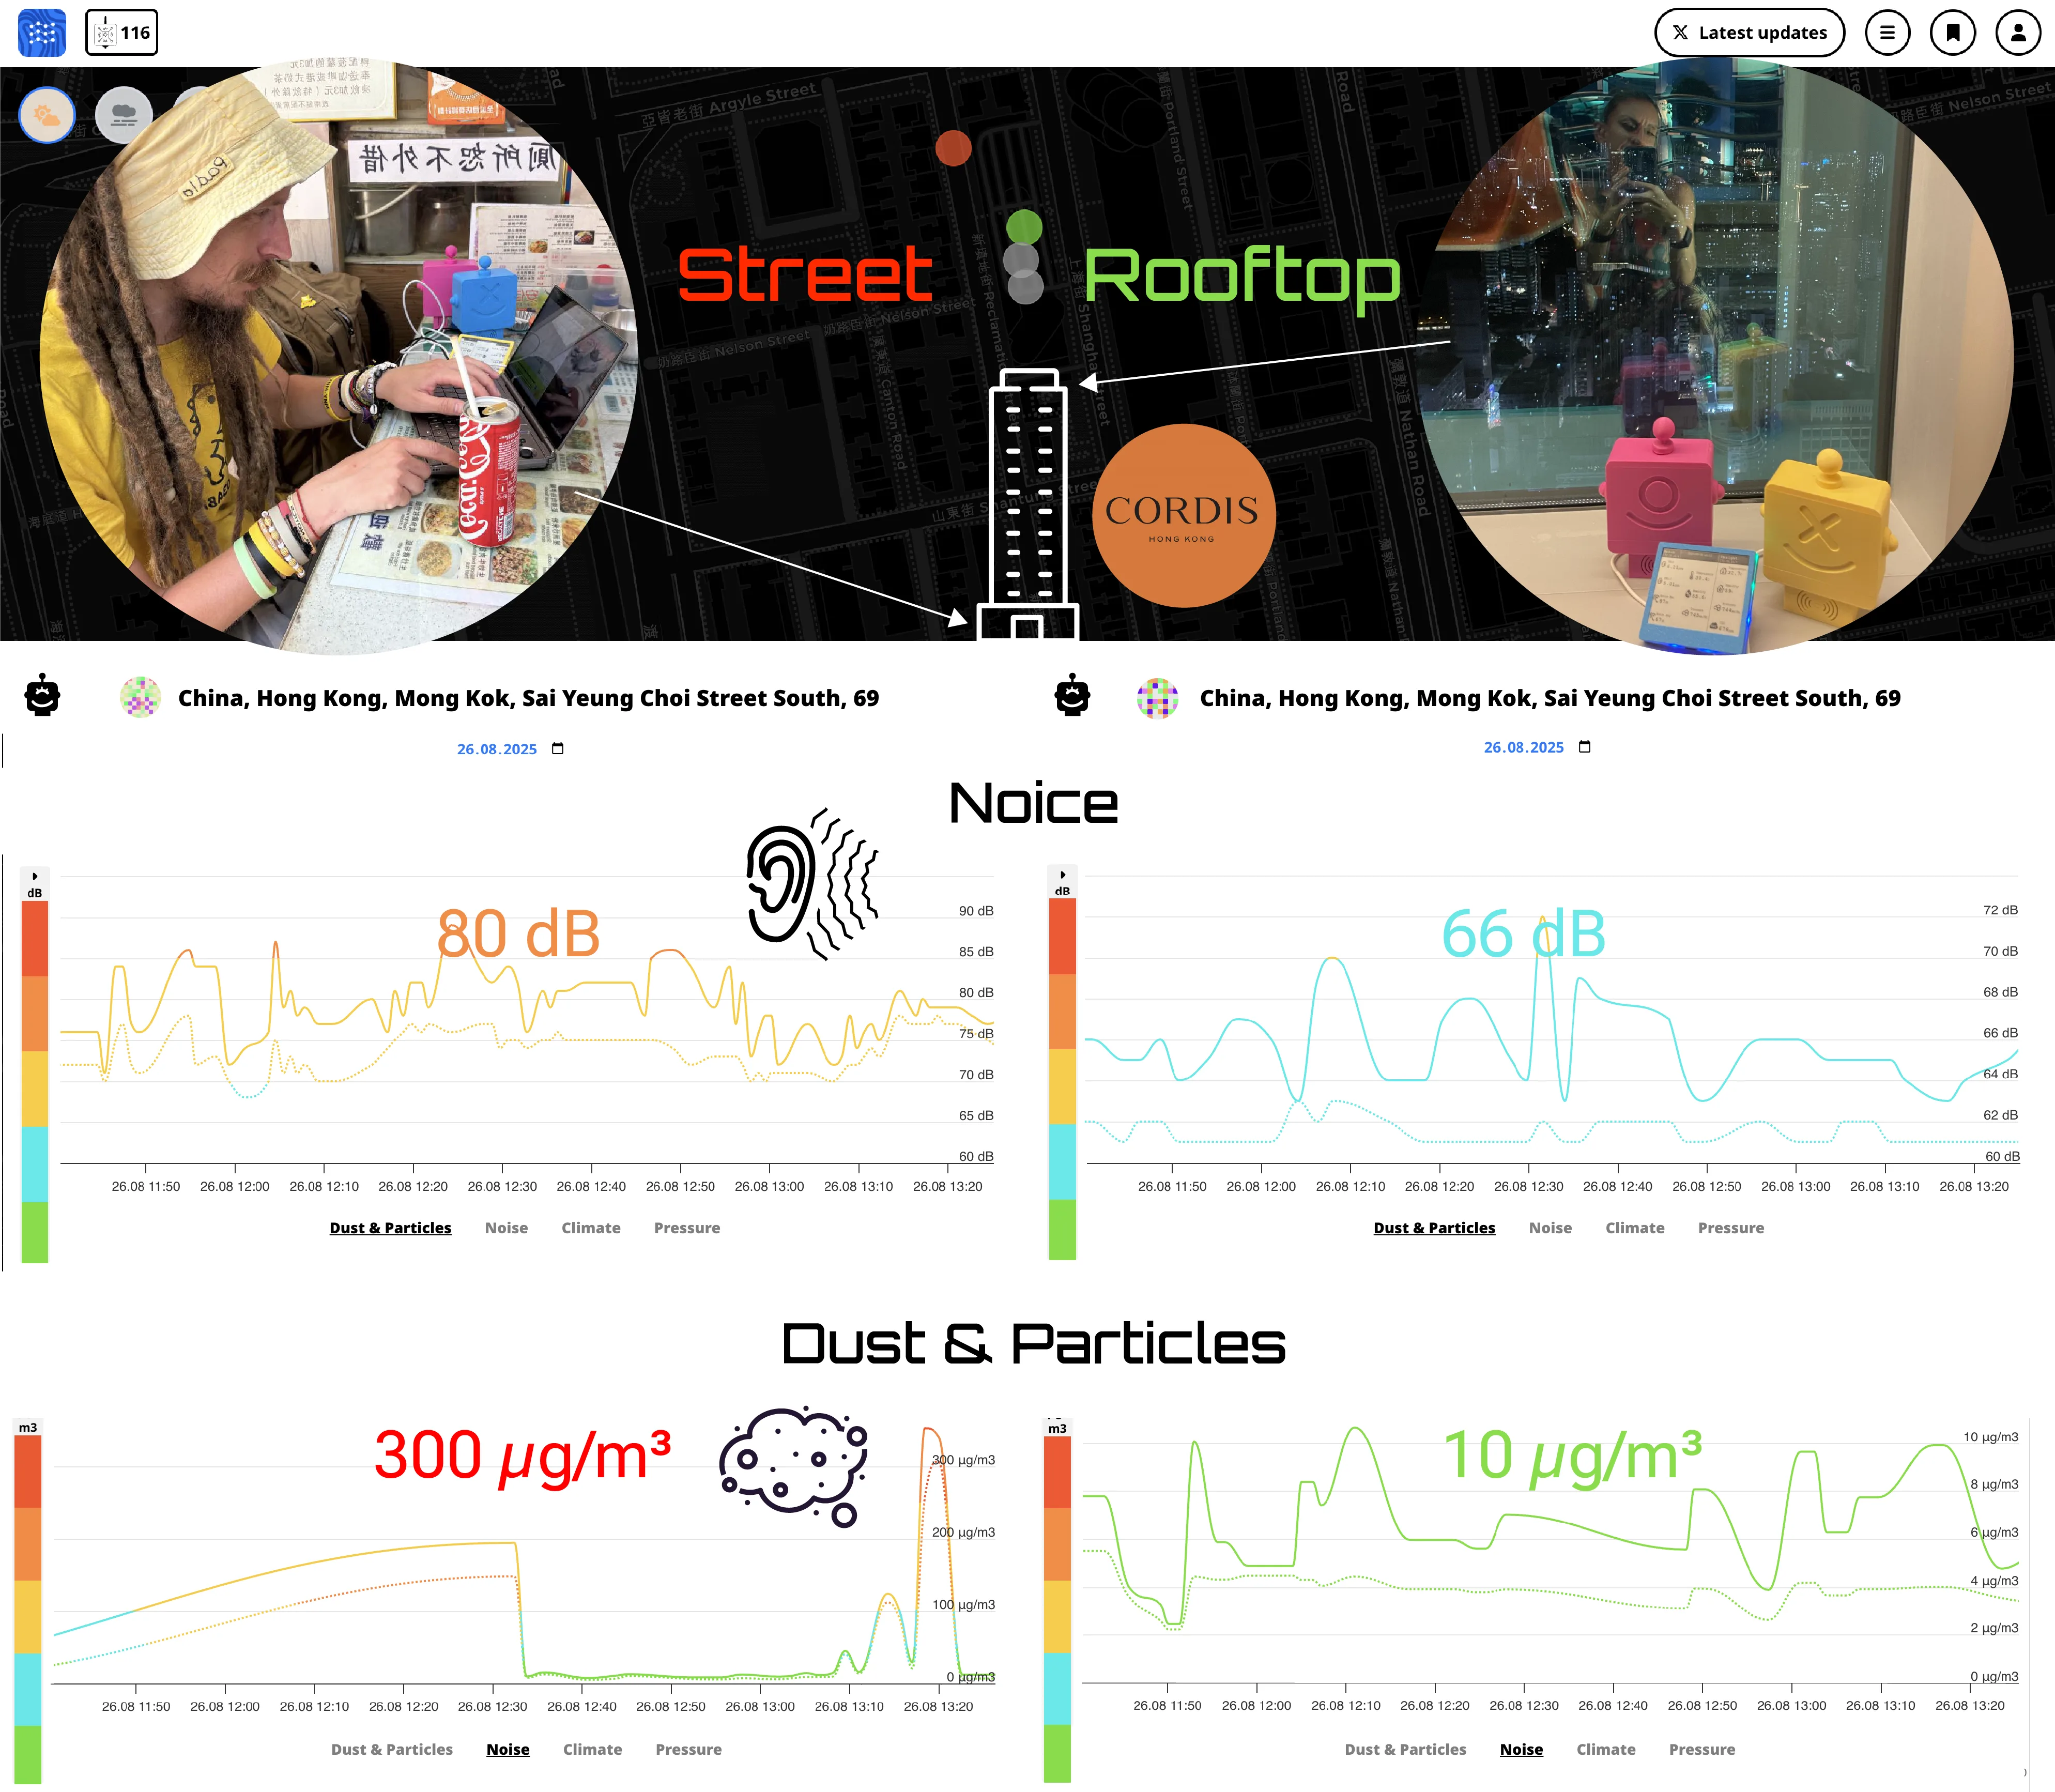
Hong Kong relaxation hotel: vertical measurements
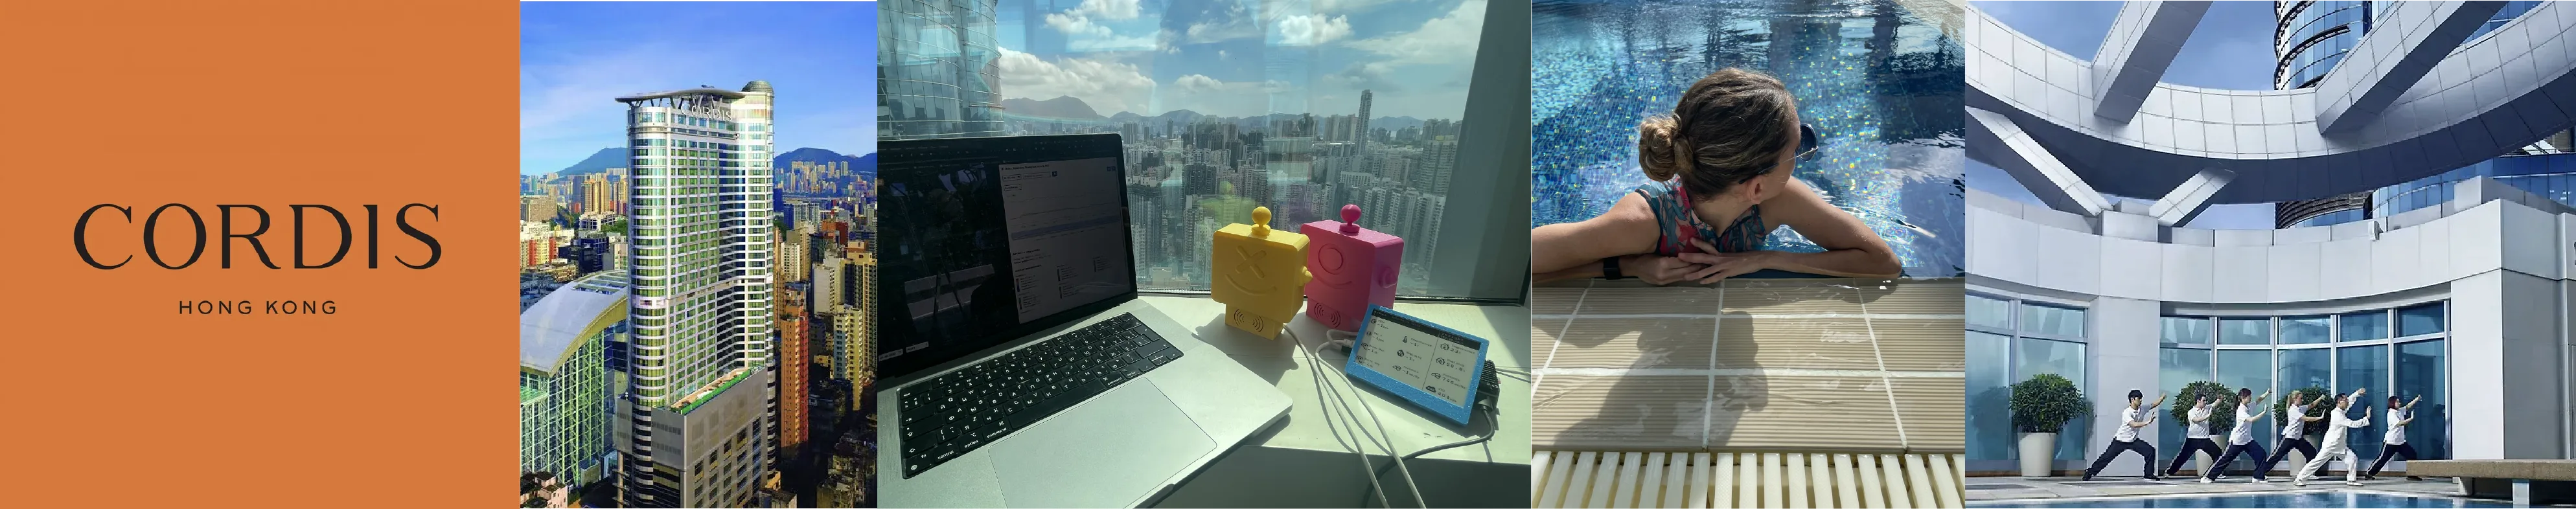
In Hong Kong, we conducted another interesting test in a high-rise hotel, placing two sensors simultaneously:
- one on the busy street at the hotel entrance
- the other on the open rooftop in the relaxation area, where guests unwind in the jacuzzi, practice yoga, and do Tai Chi
Result
On the street, noise levels ranged from 75–90 dB, while on the rooftop the average was 64–68 dB — noticeably more comfortable after spending time on the busy streets of Hong Kong.
Yes, even in the middle of a metropolis, you can experience acoustic comfort.
At the same time, we also monitored air quality. On the street, PM10 levels (urban pollutants such as dust, exhaust, and other particles) spiked above 300 µg/m³.
On the rooftop, the air was significantly cleaner — staying at levels up to 10 µg/m³.
This experiment breaks a common stereotype: even in the heart of a megacity, you can find both quiet and clean air.
Practical application
For the hospitality industry: you can showcase the acoustic comfort of your property and the air quality in relaxation areas to potential guests — especially in large cities.
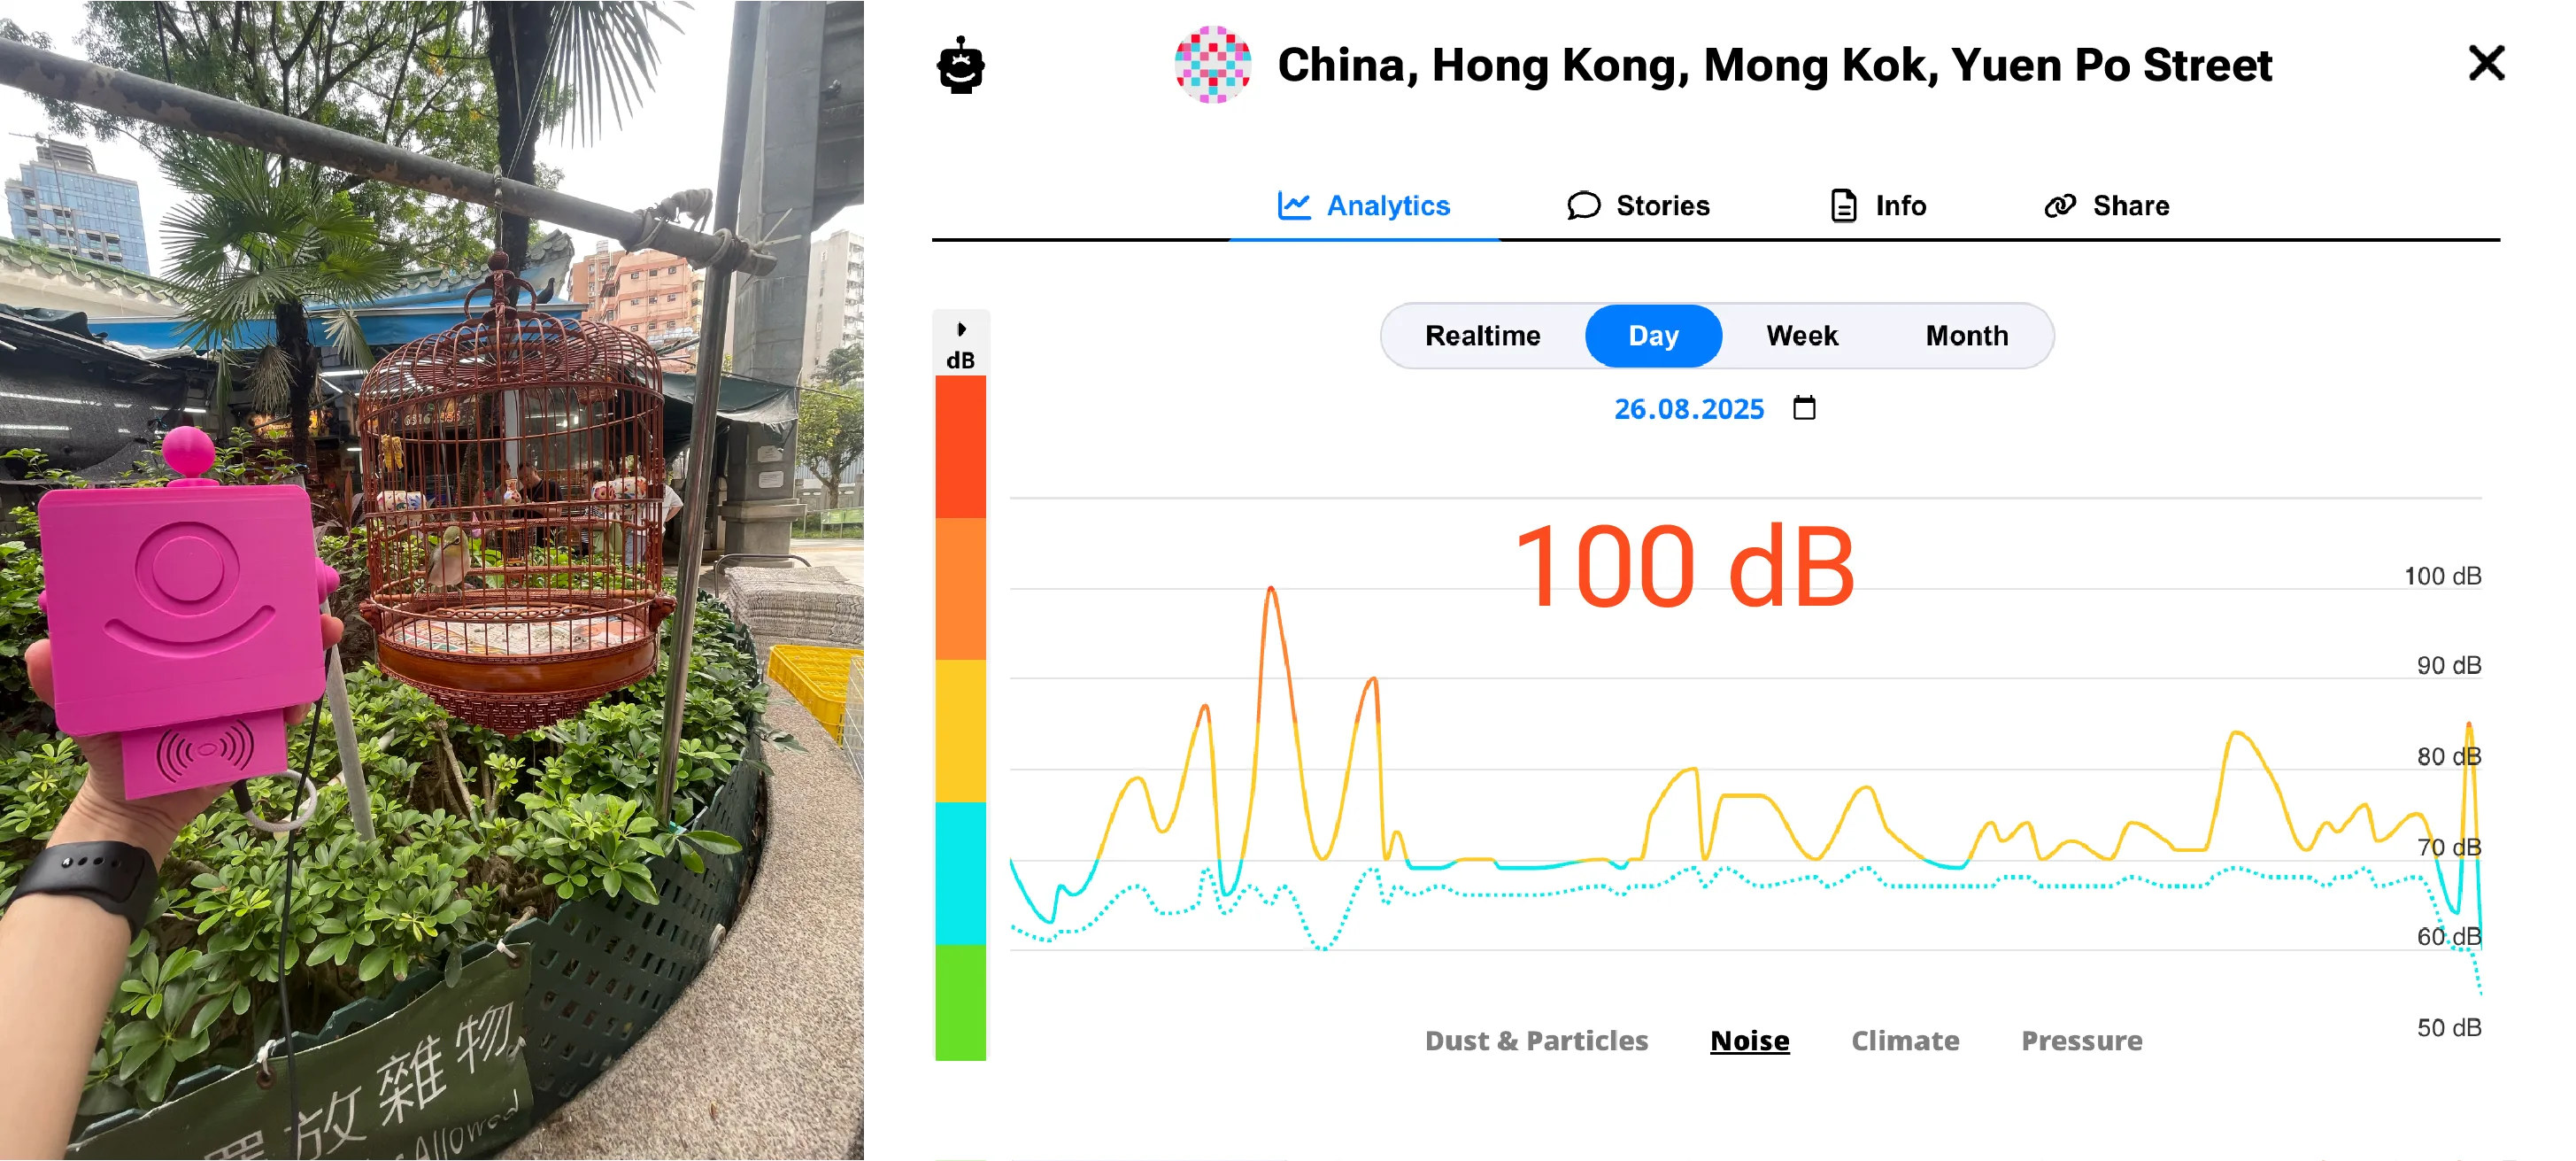
The most unexpected test: Yuen Po Street Bird Garden in Hong Kong
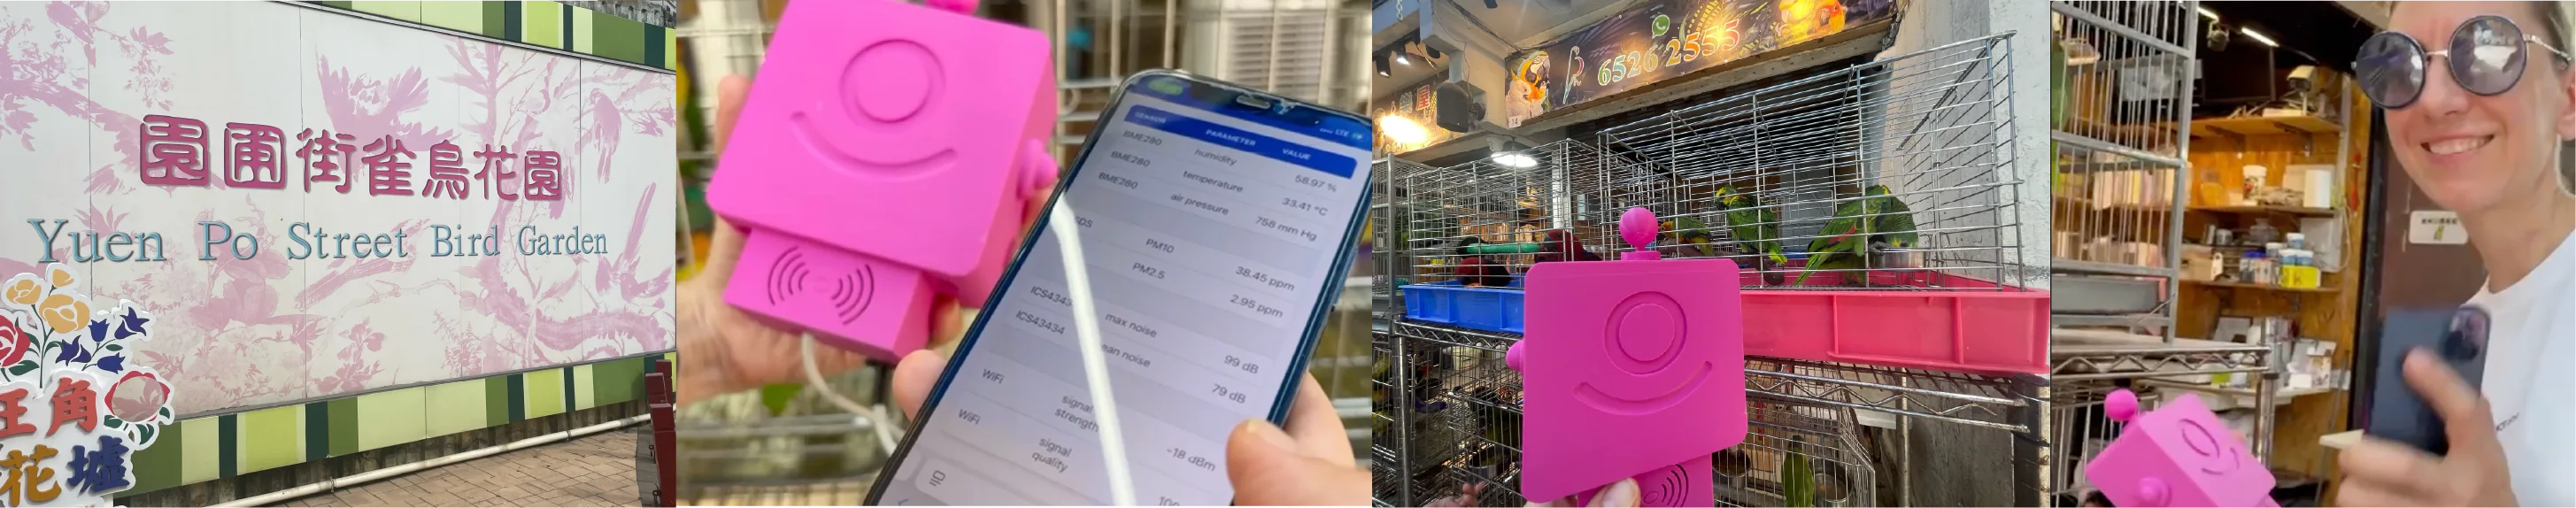
After comparing noise levels at a concert in a European castle and testing sound in megacities, I decided to look for something truly unusual and went to the famous bird market in Hong Kong.
It turned out that small birds can generate very high noise levels — almost like a concert. It was a great stress test for the sensor, and honestly one of the most unexpected results of the entire series of experiments.
Practical application
For city services and public space management:
Measurements help identify where it is truly noisy — in markets, tourist streets, and high-traffic areas — enabling data-driven decisions.
Deploying multiple sensors around noisy locations provides a more complete picture. Residents of nearby buildings can also be involved in the process, increasing civic engagement and helping better monitor noise levels and air pollution.
🔥 The most extreme noise test: Waterfall Party (Koh Phangan)
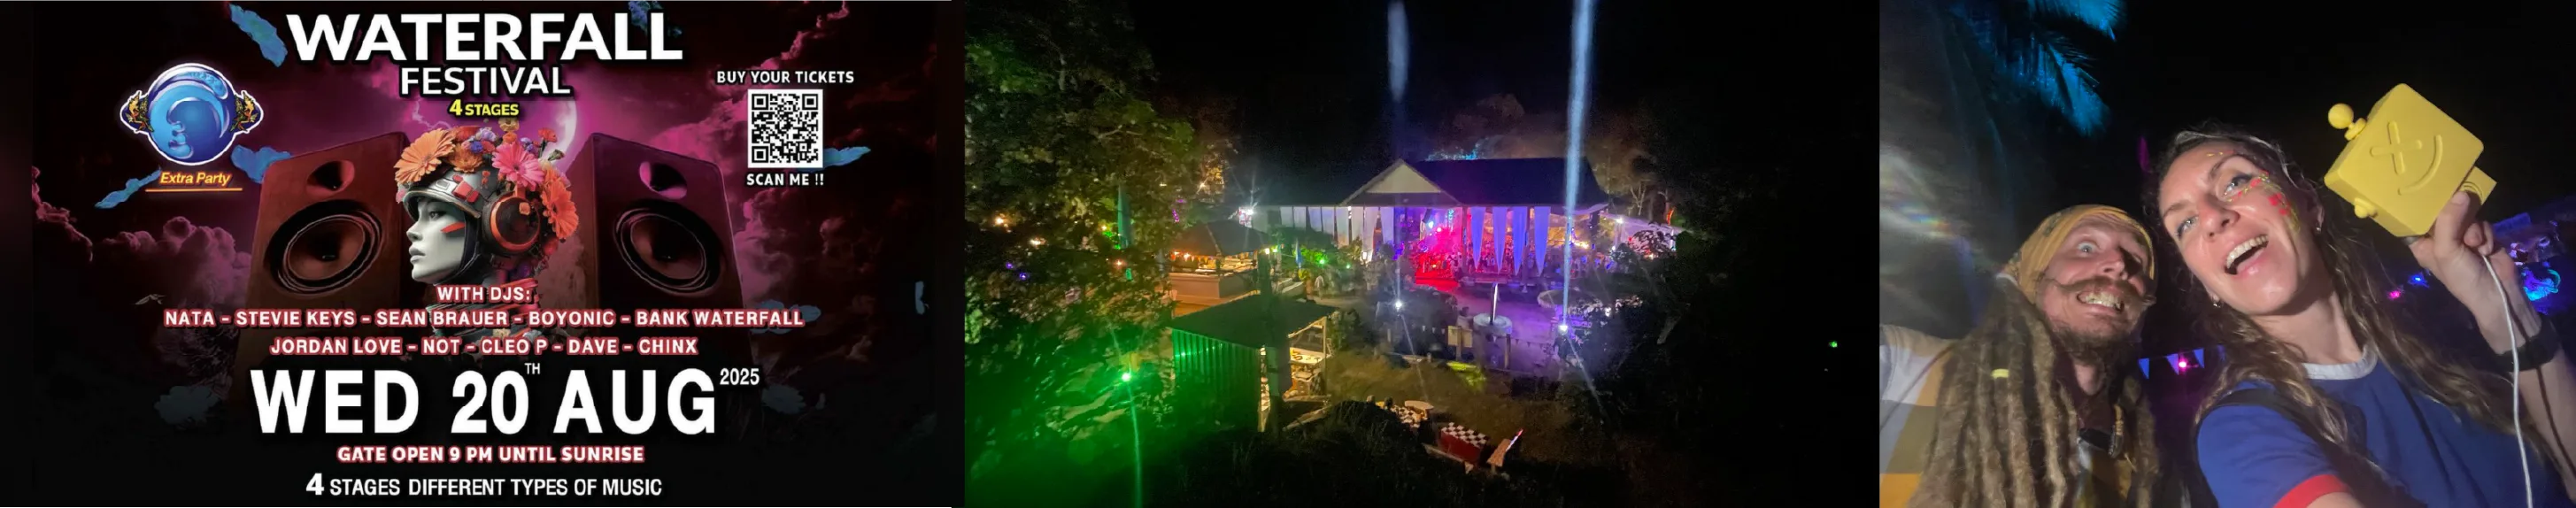
The Waterfall Party festival on Koh Phangan:
- multiple stages
- hundreds of people
- powerful sound
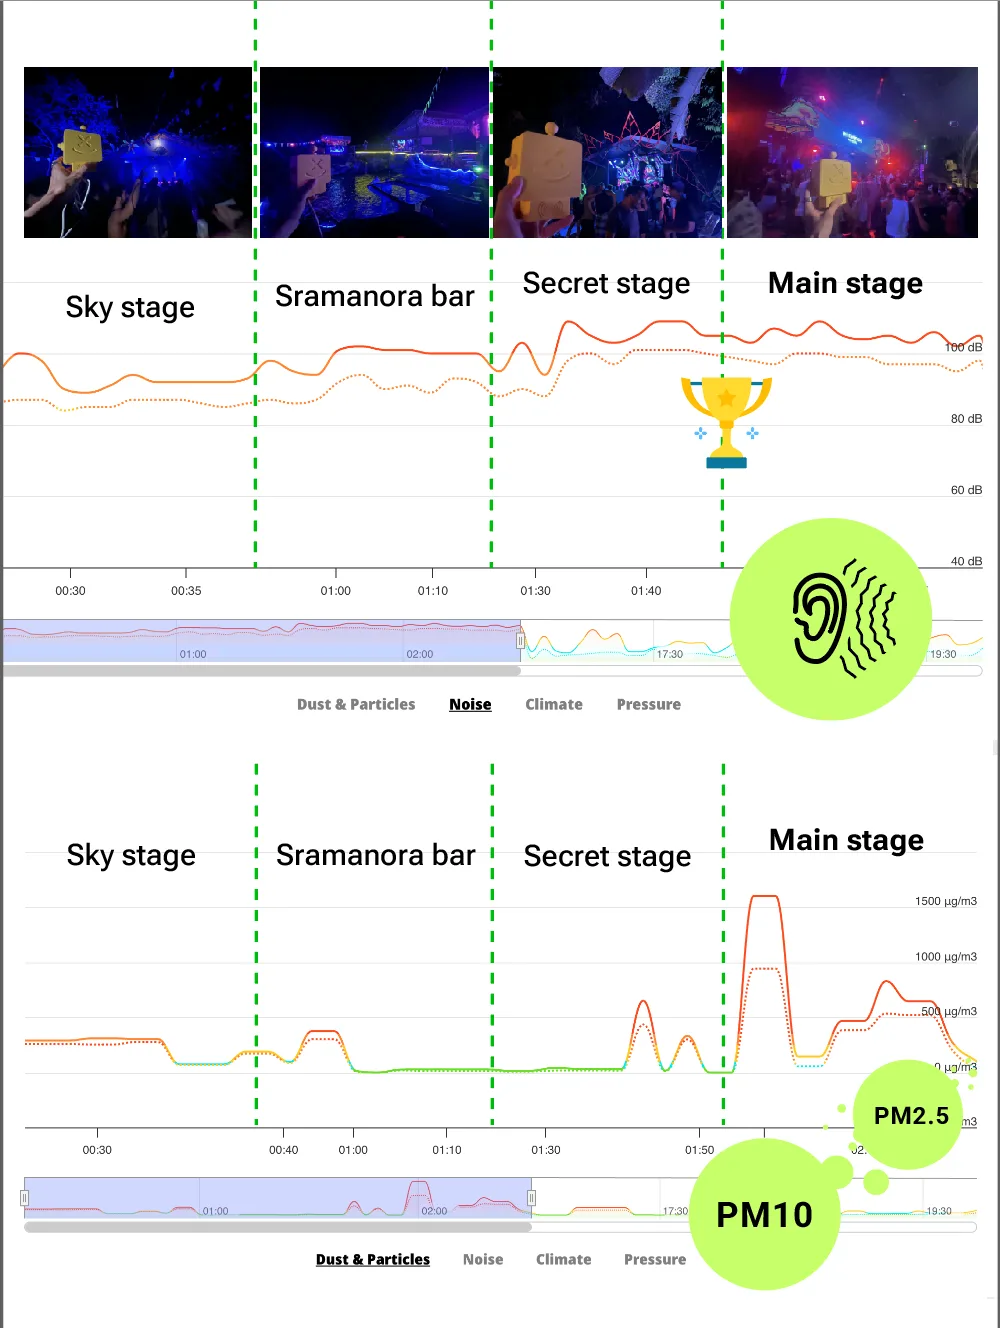
I measured noise levels across all four stages: Sky Stage, Main Stage, Secret Stage, and Sramanora bar.
Result: the loudest stages are not always the biggest ones. The consistently highest levels were recorded at both the main large stage (“Main Stage”) and the smaller “Secret Stage.”
This shows that acoustics depend not only on scale, but also on placement and sound setup.
Practical application
As in the Burg Clam concert case, this scenario is valuable for event organizers and sound engineers.
- sound tuning and acoustic distribution across the venue
- analysis of noise propagation in different zones
- optimization of stage placement and sound system setup
👉 Especially relevant for multi-stage events — to avoid sound overlap and maintain acoustic comfort.
From a biohacker perspective, I’d add that having access to data from such events in advance is incredibly useful. I would really appreciate it if organizers shared open data on noise levels and air quality — especially for recurring events. It helps understand where you can spend more time without stressing your body, where it’s better to limit exposure, and how to prepare for recovery in advance ;)
Because beyond the sound levels, I also observed air pollution patterns — and at certain moments, the readings reached truly critical levels.
Key takeaways
1) Noise is data, not perception
People often overestimate or underestimate the impact of sound.
2) A city is a complex system
Even 500 meters can change everything.
3) Data creates new insights
- concerts can be analyzed
- cities can be compared, studied, and improved
- environments can be optimized
Altruist is not just a sensor.
It’s a tool for building a transparent map of the urban environment.
All data can be stored, compared, and shared on the open map sensors.social — and this is where the real power of Altruist lies: it shifts the conversation about noise from subjective complaints to verifiable, transparent data.
We are used to perceiving the environment through feelings and impressions.
But when you have data — you start to see the world differently.