
--prometheus-port applies to the parachain side only. The embedded relay-chain exporter always takes 9616, regardless. Two nodes on one host will fight over it, the one that starts second silently loses its relay metrics, and nothing in the logs or in the service state tells you so.
Collator rewards, measured: runtime 43 from the operator seat
Five days of notes from the operator's chair: what the 4.3.0 client update took, why my node sat idle with a green dashboard, what entering the active set actually looked like, and what the new per-block reward measures out to in practice. EnsRationis [Robonomics Software Architect]
Runtime 43 activated on the Polkadot side of Robonomics on August 18 at 02:53 UTC, and the headline item in it is one collators have been waiting for: Introduced collators reward. Blocks now pay.
I run one of the collators, so I had a front-row seat for the week around it — including the parts that did not go smoothly. These are the operator’s notes: what the client update took, why my node produced nothing for a day while a dashboard cheerfully showed green, what entering the active set actually looks like on chain, and what the new reward measures out to when you count it instead of reading the changelog.
Every number below was read off the chain and off the node, not estimated.
Day one: the client update, and a port collision nobody reports
v4.3.0 shipped a client bump to Polkadot SDK 1.24.0. The update itself was routine — back up the current binary, unpack the release, and, before installing, run --version on the unpacked file and push every flag from the systemd units through --help. That last step is worth the two minutes: it is how you find out that a release dropped a flag your unit still passes before the restart fails, instead of after.
Nothing was dropped, the units needed no edits, and both nodes came back on 4.3.0 :: Polkadot 1.24.0.
What did surface was a latent misconfiguration that I suspect is not unique to me. If you run two Robonomics nodes on one host — say a Polkadot collator and a Kusama full node — --prometheus-port is not enough to keep them apart:
The node does not fail, does not warn, and reports itself healthy. You only notice when you go looking for relay metrics that were never there. Even a node running with --relay-chain-rpc-urls — which has no full relay node of its own — still claims the port.
The fix is to set the relay-side port explicitly, in the section after --:
# parachain side
--prometheus-port 9615
# relay side, after the separator
-- --prometheus-port 9616
Give the second node a different pair (9625 / 9626) and both sets of metrics come up. Worth checking on any host with more than one node on it.
Why my collator produced nothing — and why the dashboard did not say so
The symptom: zero authored blocks all day, an unmoving balance, and a status page reading “Registered, Awaiting Slot” in green.
The node side was, as far as it could tell, perfect. session.setKeys had gone through, the on-chain nextKeys matched the keystore, author_hasSessionKeys returned true, the node had the AUTHORITY role and reported Is collating: yes. Every check that looks at the node passed.
The chain said something else:
candidateList        : 2 entries — my account is not among them
reserved balance     : 0 XRT     — the candidacy bond was never reserved
lastAuthoredBlock    : empty     — never was a candidate
My first guess had been competition for slots — wrong, and worth flagging because it is the intuitive guess. desiredCandidates was 25 with 2 taken. There were 23 free seats and no competition whatsoever.
The actual cause was one missing extrinsic. In my setup script setKeys runs first and collatorSelection.registerAsCandidate() second; the first had landed, the second had aborted at some point in the past. Sending it reserved the 32 XRT bond and emitted CandidateAdded, and that was the whole fix.
The part I would rather other operators take from this is not the missing extrinsic — it is why it stayed invisible for so long. The dashboard’s status logic never queried the chain at all. “Registered, Awaiting Slot” was its default branch for synced + marked as collator + no blocks yet, and it painted that green. The word “Registered” was backed by nothing. A status page that infers state from the node alone will confidently tell you that an unregistered collator is fine.
If you take one thing from this post: verify candidacy against candidateList / invulnerables on chain, and treat absence as a red state. Node-side health is necessary and nowhere near sufficient.
Entering the active set
The first authored block came roughly 12 hours after registerAsCandidate() landed — one session rotation plus change.
Once in, the share was exactly what the set size predicts. Over an 8 h 47 min window the node authored 872 unique heights out of 4,995 blocks — 17.5%, against an expected 1/6 = 16.7% for a set of six. No gaps, no missed slots.
One counting note, since it will bite anyone measuring this from logs: count unique heights, not Pre-sealed block lines. Over that window the log held 1,151 such lines for 872 heights — some heights get proposed twice. Grepping and using wc -l overstates your share by a third.
Two smaller findings from the same session, both practical:
- Session length is not in the metadata. The
Periodconstant is not set, so there is nothing to read. I derived it from three observed rotations instead: ~2,980 blocks at 6.33 s/block, so roughly 5 h 15 min. - Historical queries do not work on a warp-synced node. Any loop over past blocks dies with
4003: State already discardedafter a few hundred blocks. If you want history, plan for an archive node; otherwise measure forward from now.
Runtime 43: the upgrade itself was a non-event
This is the part that deserves credit. The runtime upgrade applied on a live process. No restart, NRestarts=0, uptime unbroken from five days earlier, and not one WARN or ERROR anywhere around the migration — only the initialization markers:
🐥 New pallet "Proxy" detected in the runtime ... StorageVersion(0)
🐥 New pallet "CPS"   detected in the runtime ... StorageVersion(1)
No binary update was required either — the client stayed on 4.3.0, which was already running. From the operator’s side the entire economic change arrived while the process was untouched.
The Kusama side is still on runtime 42 at the time of writing. Two different networks, not a lagging node — worth keeping straight before anyone goes looking for minted rewards there.
What the reward actually is
Rather than take the changelog at its word, I watched the events. On every authored height:
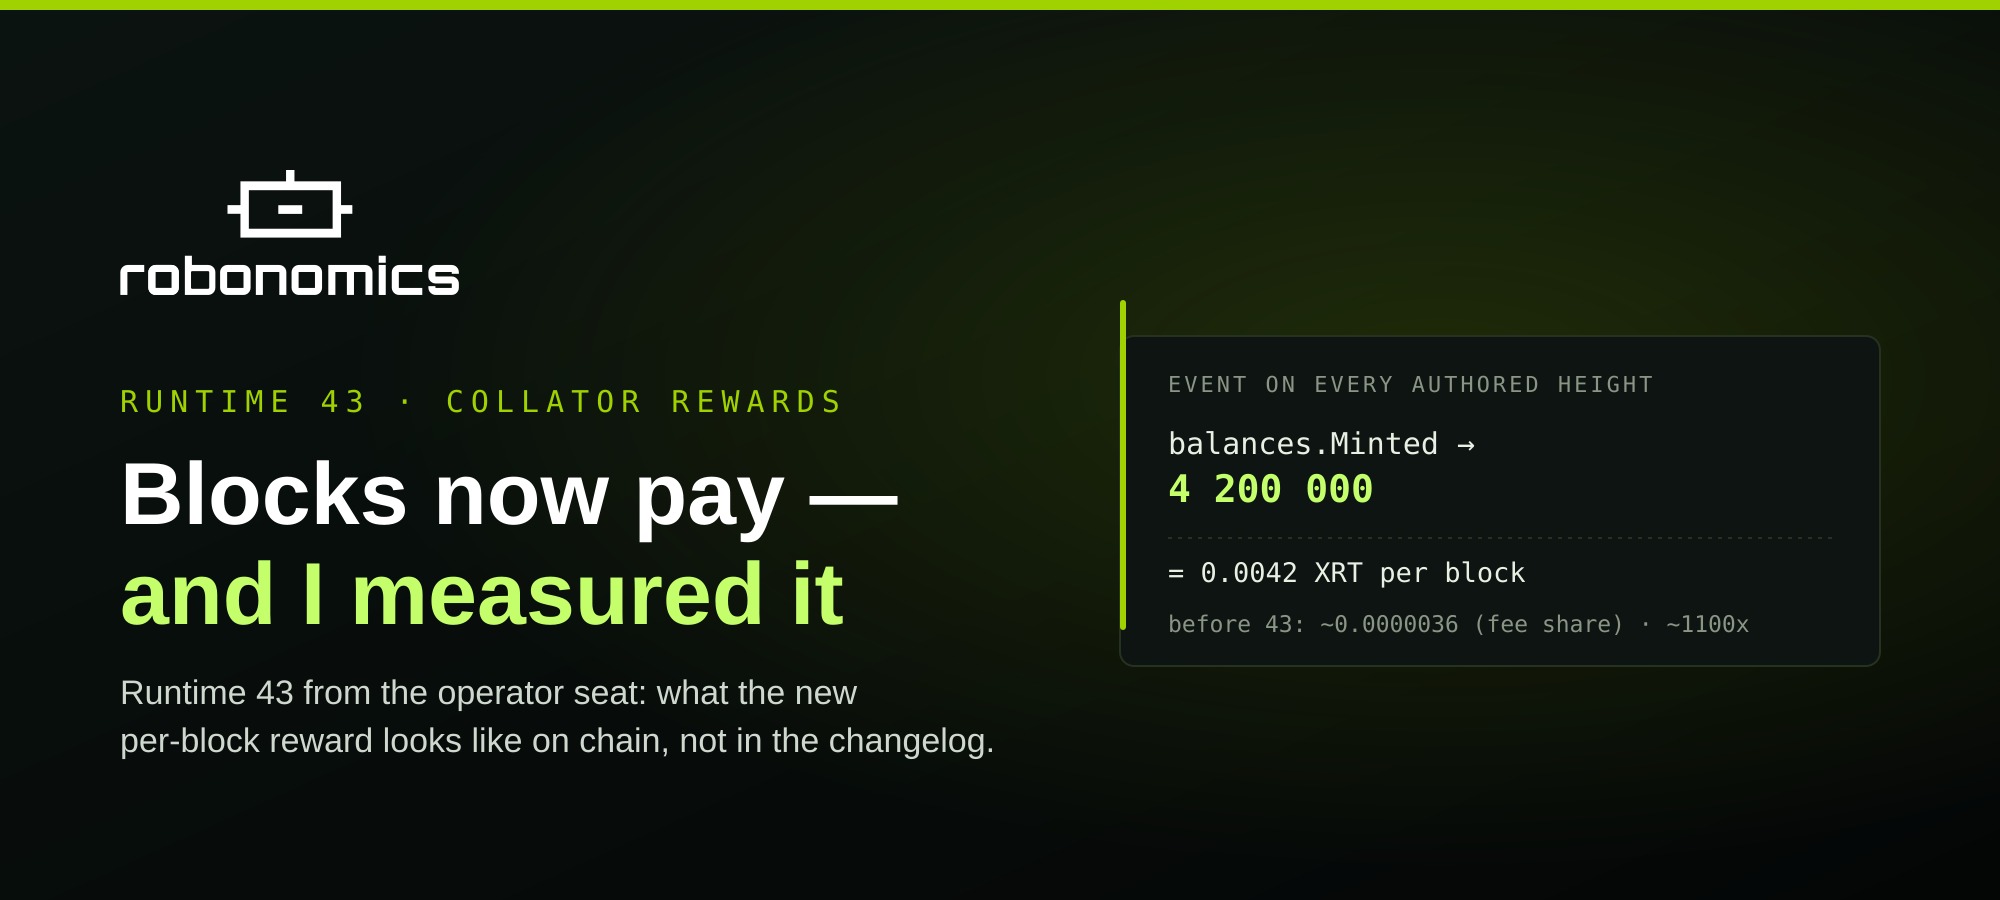
balances.Minted → <my collator account> 4 200 000
That is 0.0042 XRT per authored block, and it is Minted — fresh issuance, not a redistribution out of a fee pot. The old fee share has not gone anywhere; those tiny balances.Transfer events still arrive in parallel, at the same order of magnitude as before. They are simply invisible at this scale now:
| before 43 | after 43 | |
|---|---|---|
| Source | share of collected fees | balances.Minted, issuance |
| Per block | ~0.0000036 XRT | 0.0042 XRT |
| Per day at a 1/7 share | ~0.0085 XRT | ~8 XRT |
Roughly a 1,100x change per block.
The number is not arbitrary, which I found the most interesting thing in the release. It is derived from what running the reference hardware actually costs:
reward = (server cost per year × number of collators × 1.3)
       / blocks per year / XRT price
       = (2040 × 7 × 1.3) / 4 505 143 / 1
       ≈ 0.0042 XRT
2040 is the annual server cost, 7 the assumed collator count, 1.3 a 30% margin on top, 4,505,143 the blocks in a year. Issuance is pinned to the real cost of keeping a node up, and when the inputs move — hardware prices, the minimum collator count, the token price — the constant gets revisited and the spec version bumped.
There is also a nice engineering detail in how it is paid. The reward is minted directly to the block author, bypassing the collator_selection pot — because note_author hands the author only half of that pot, so routing the reward through it would have quietly paid collators half of the intended amount. Consequently AuthorRewards must sit before CollatorSelection in the runtime’s EventHandler tuple, which is called out in a comment in the code.
Measured, not assumed
On a live 100-block window (10 min 24 s), the node authored 15 of those heights and the free balance moved by +0.0588 XRT. That is 0.0039 XRT per authored block — consistent with 0.0042 once you account for reward events landing across the window boundaries.
It holds on the longer arm too. Comparing balances from four days earlier: at the old rate the pre-upgrade stretch should have accrued about 0.03 XRT, and the new rate over the eight hours since activation about 2.7 XRT. The observed total matched almost exactly.
The caveat on yield, stated plainly
~8 XRT/day is a rate at a specific share, not a property of the network. The per-block reward is fixed. The number of blocks each collator gets is not.
At the time of measurement the active set was 7 — 3 invulnerables plus 4 candidates — while desiredCandidates is 25. If the set fills out to 28, the share drops from 1/7 to 1/28 and the same fixed reward yields ~2 XRT/day. Note that the formula above was itself computed for 7 collators, so that is the design point rather than an accident.
The bond is unchanged at 32 XRT.
What I would hand to another operator
Everything above was verified by reading chain events and node state directly — short @polkadot/api scripts written against the local RPC, plus systemctl and journalctl. I wrote and ran most of them through Claude Code as I went, which is a genuinely good fit for this kind of work: the loop of form a hypothesis, write twenty lines to test it against the chain, discard it, try the next is most of what node diagnosis is, and having the scripts appear as fast as the hypotheses meant I checked things I would otherwise have assumed.
It cuts the other way too, and the lesson is the same one as the dashboard. At one point I measured a database growth rate over a 20-hour window and got a figure that looked alarming; re-measured over four days, the real rate was about a third of that. RocksDB compaction throws off short windows badly. Neither a tool nor a status page will tell you that your measurement window was too short — only a second measurement will.
The short checklist, then:
- Verify candidacy on chain, not through a status heuristic —
candidateList/invulnerables, and red when absent. - Split the Prometheus ports explicitly if more than one node shares a host; the relay exporter always wants 9616 and will not complain.
- Count unique authored heights, not
Pre-sealedlog lines. - Do not extrapolate from a short window — anything storage-related needs days, not hours.
- Watch
candidateListif you are modelling returns: the reward is fixed, your share is not.
Runtime 43 makes running a collator pay for itself by design rather than by accident, and it arrived without touching the process. That is a good release.
Release notes: github.com/airalab/robonomics/releases/tag/v4.3.0
 — EnsRationis, Robonomics Software Architect · https://x.com/EnsRationis