The Experiment With Beer Bar at the Polkadot Decoded 2024
Last week, the Robonomics team visited the Polkadot Decoded event in Brussels. They did an experiment to measure different readings from sensors around the Free Beer Stand from ChaosDAO. The team wanted to see how many people attended and how interested they were in the bar. Read this article to find out what they discovered.
Equipment
For the experiment, a set of sensors was chosen:
- temperature and humidity sensors
- motion sensors
- door sensors
- air quality sensor
- beer meme-counter in the form of a light bulb and two buttons
A Raspberry Pi 4 with Home Assistant installed and Robonomics integration were used to save all the data in the Web3 cloud. At the end of the article, you will see a description of how to obtain this data.
Installation
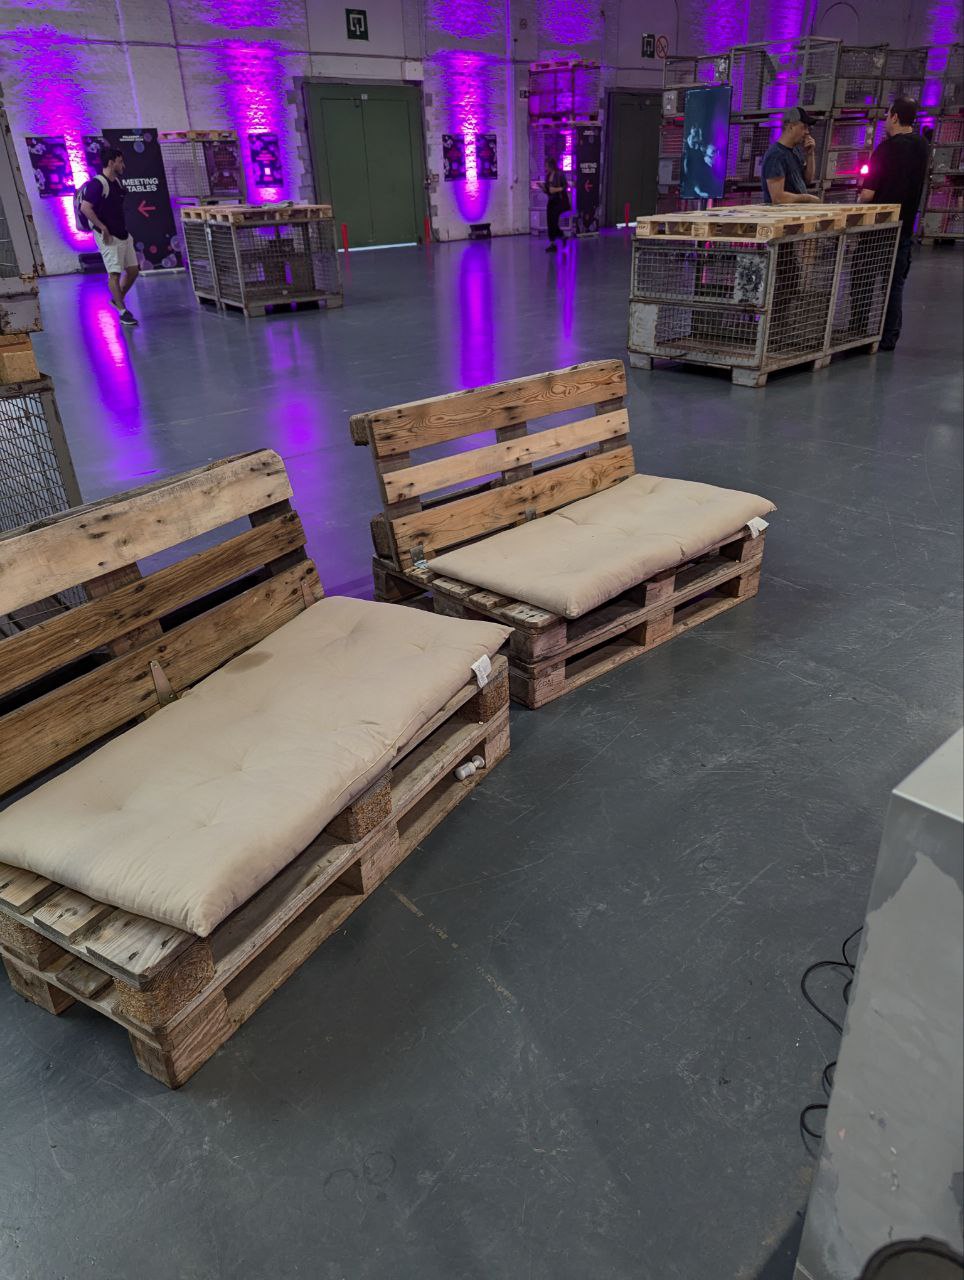
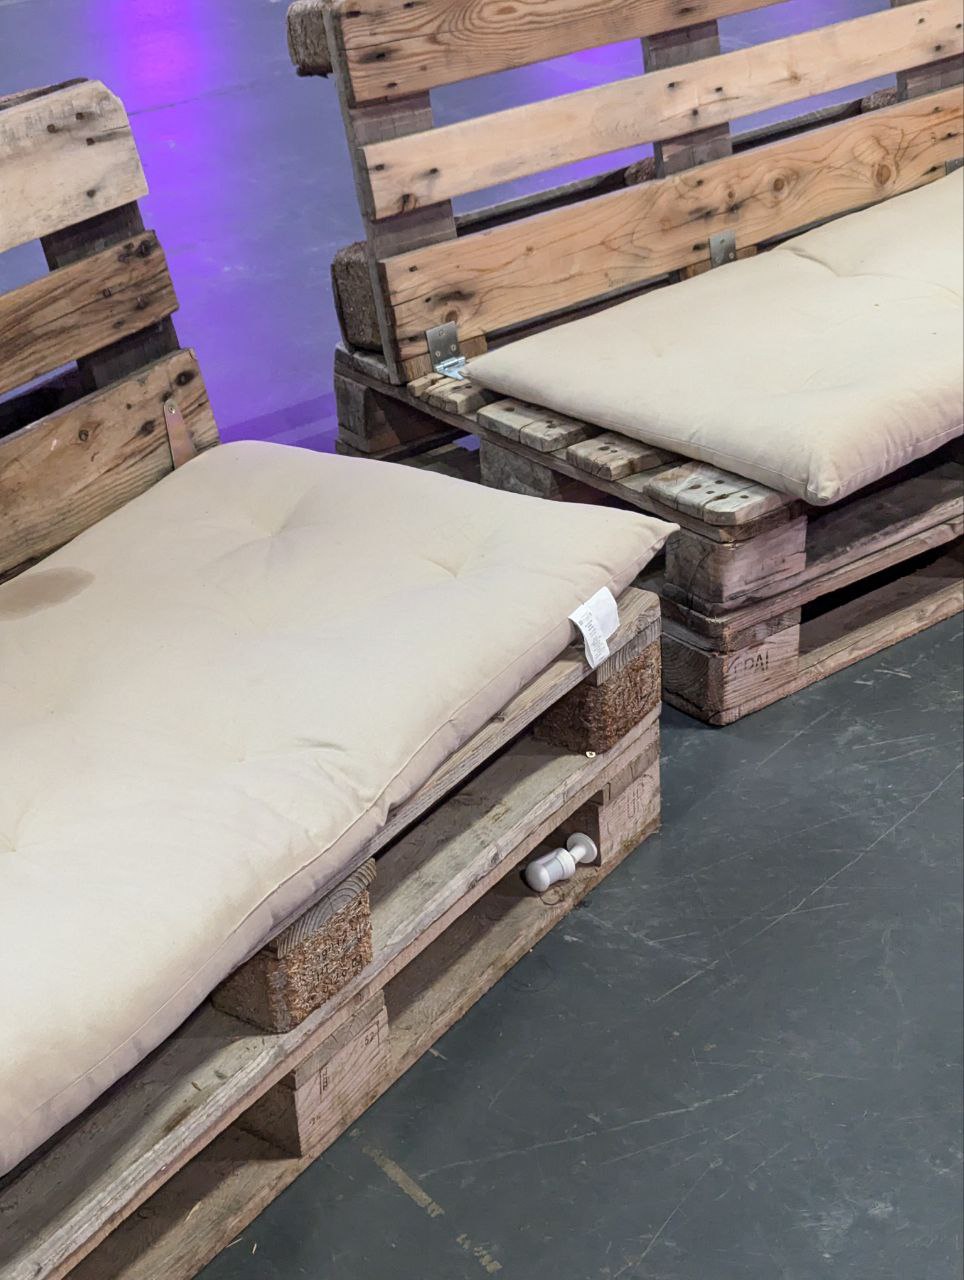
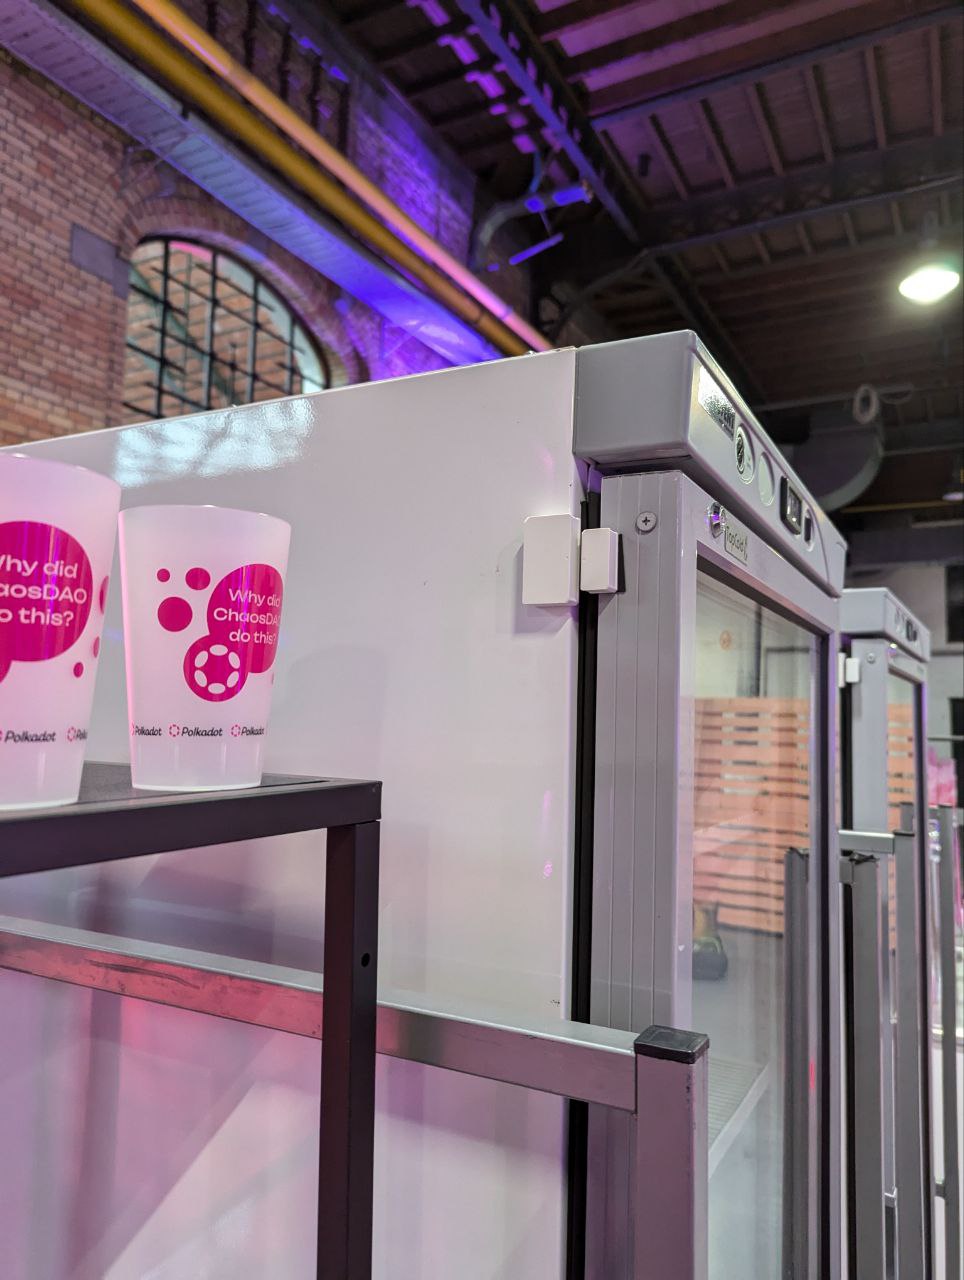
Here’s what the bar looked like:
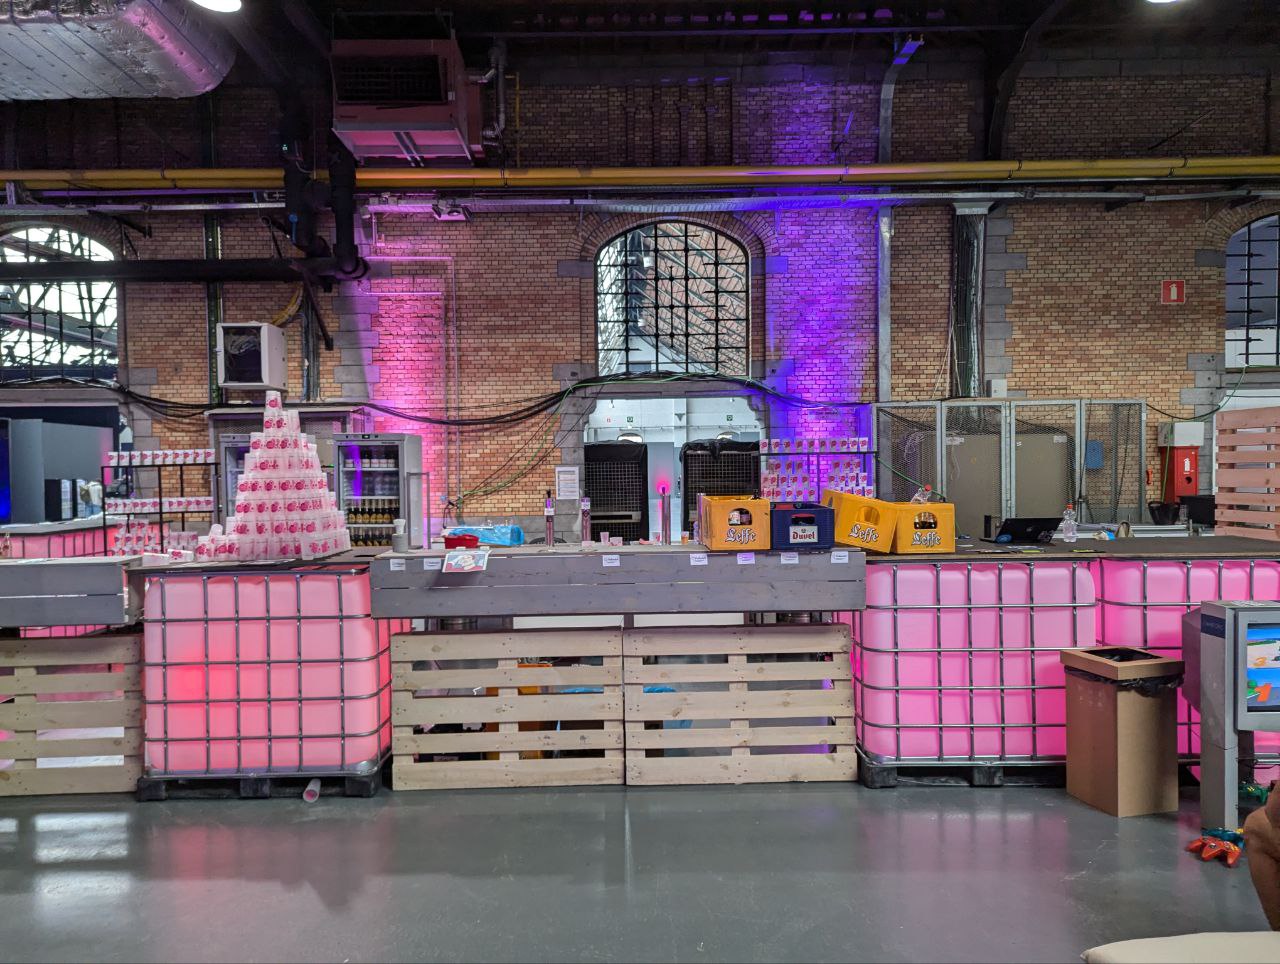
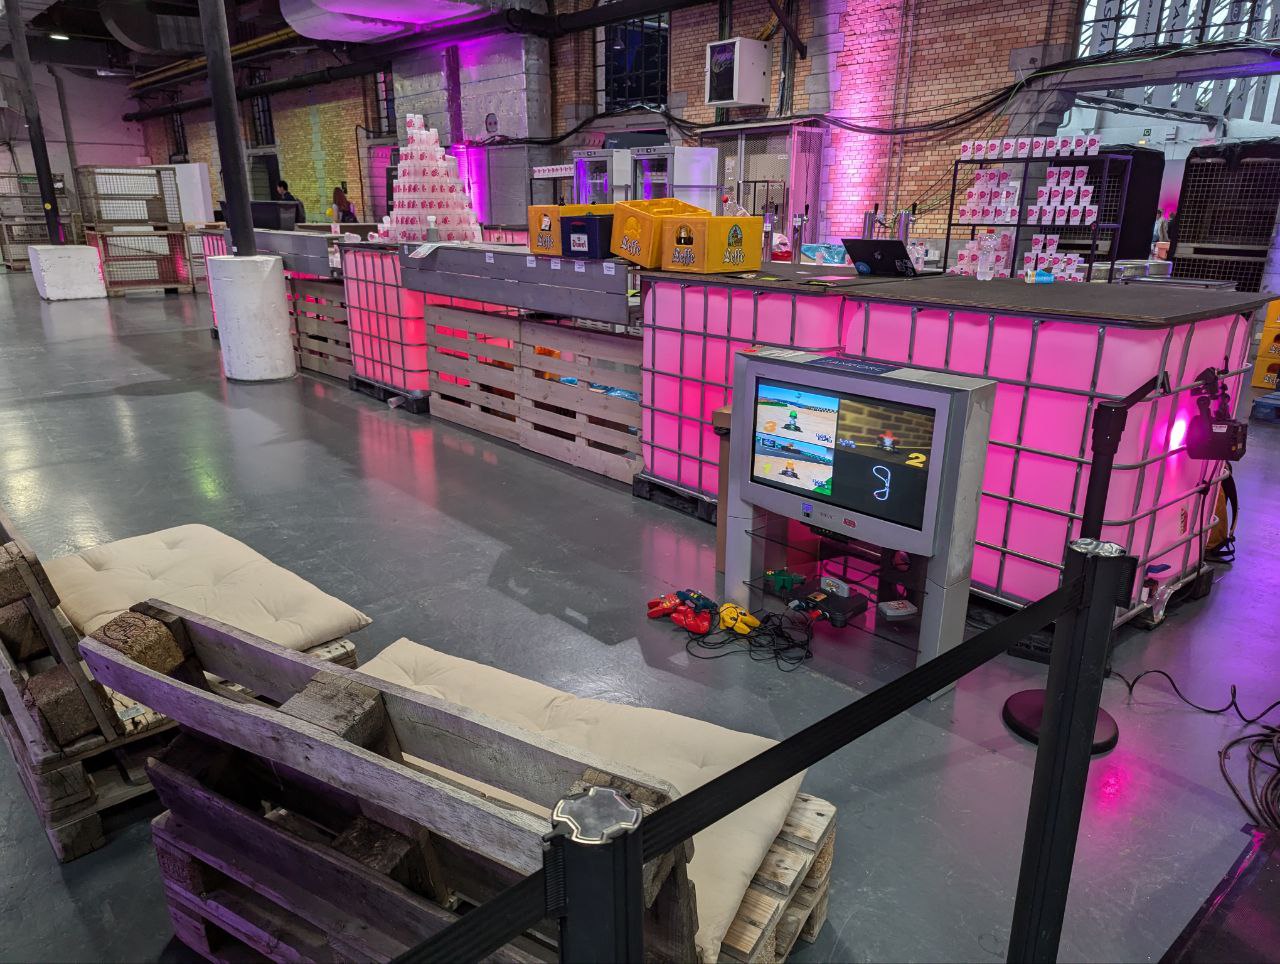
The main counter where beer was handed out. Behind the counter, there was a tap and 2 refrigerators with drinks. There were also small couches and a PlayStation 1 with racing games on the right.
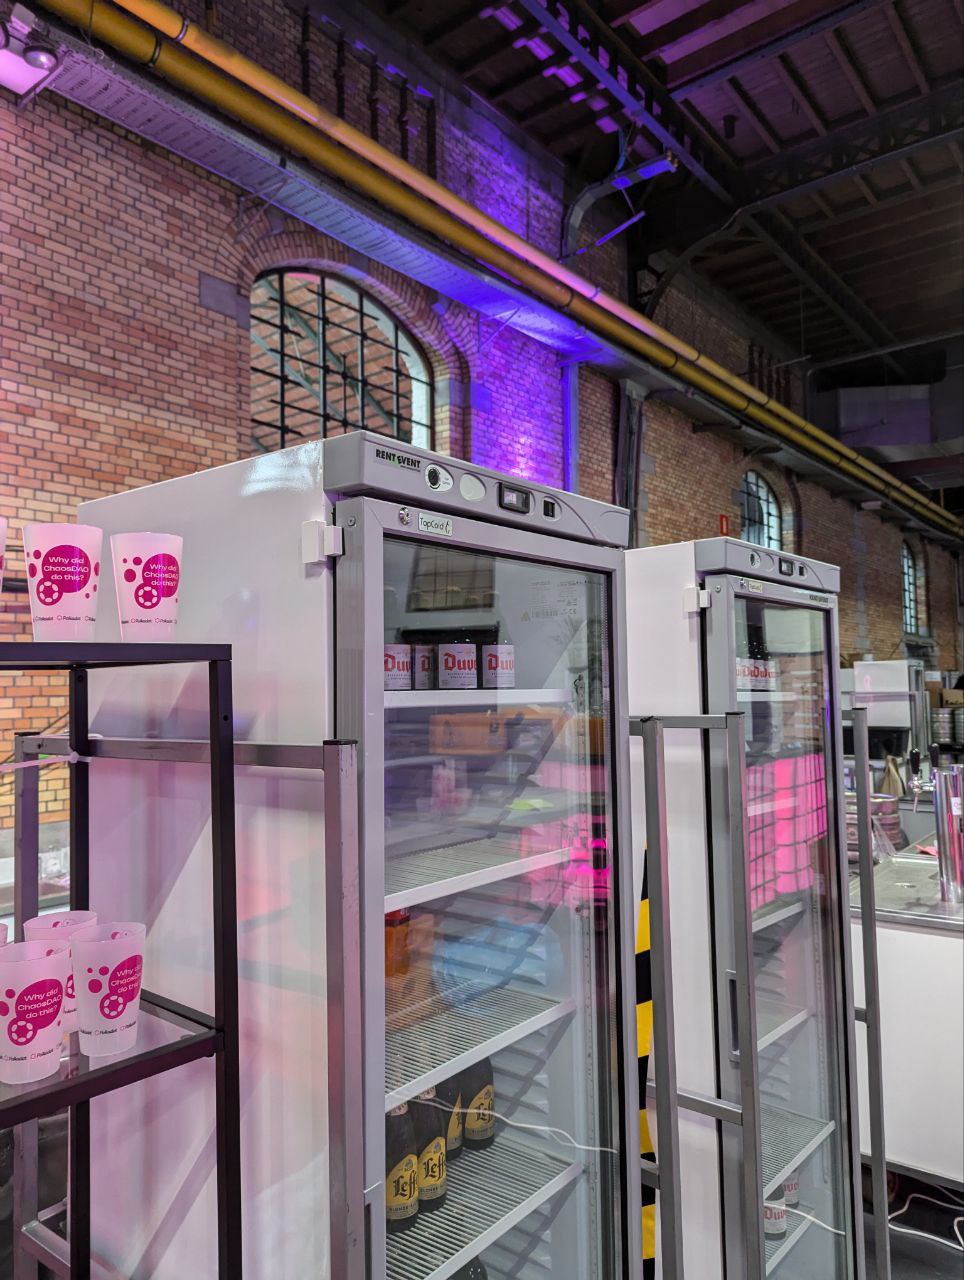
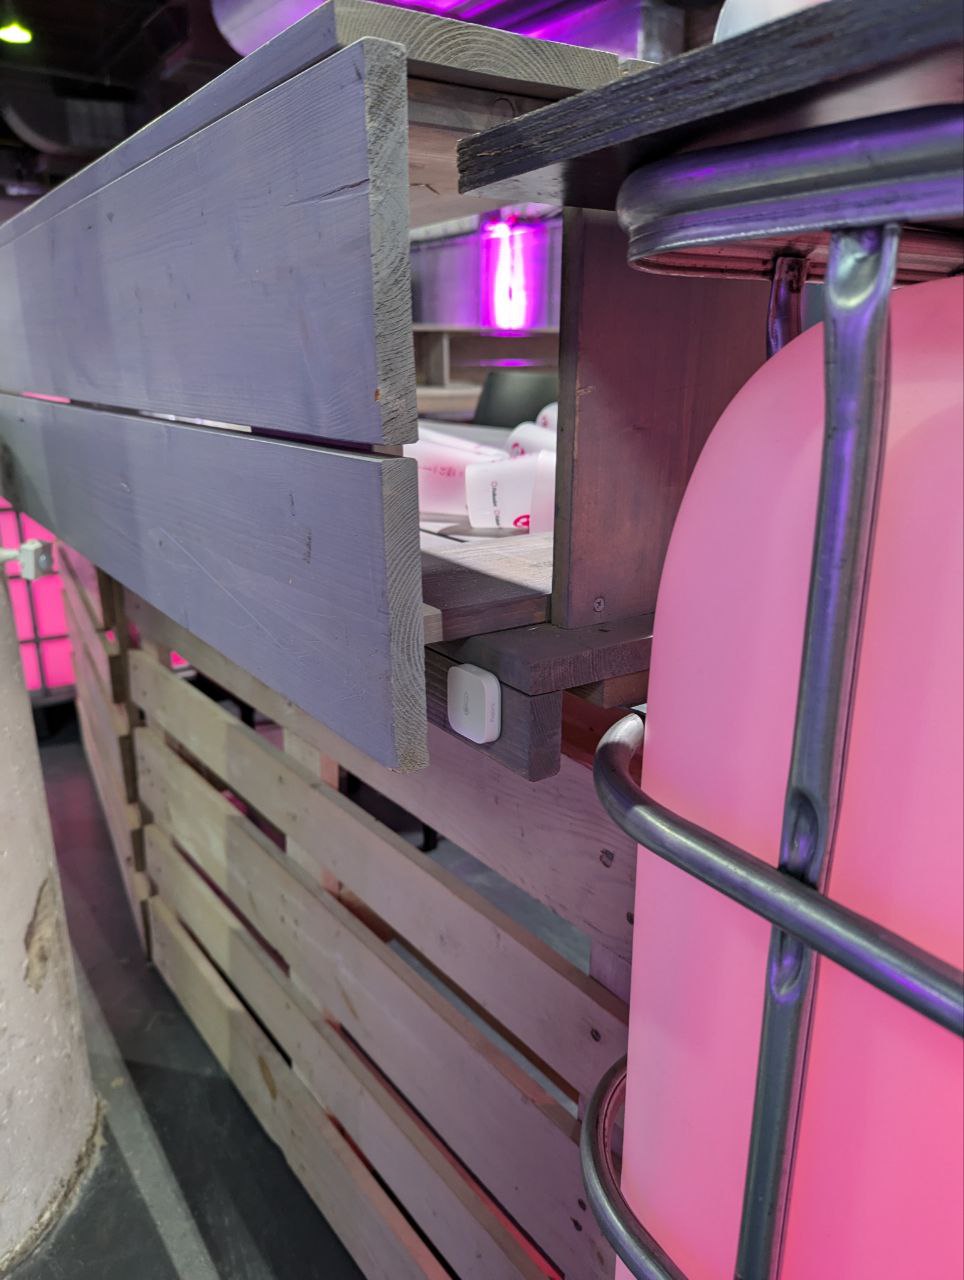
The door sensors fit perfectly on the refrigerators. This allowed us to count how many times they were opened to take out a bottle.
A motion sensor was installed in the PlayStation area so that it would only trigger when a person approached the TV to take a gamepad:
A motion sensor was also placed at the main bar counter and oriented to trigger only when a person was directly at the counter. It can be seen on the left on the column. A temperature and humidity sensor was also installed nearby:
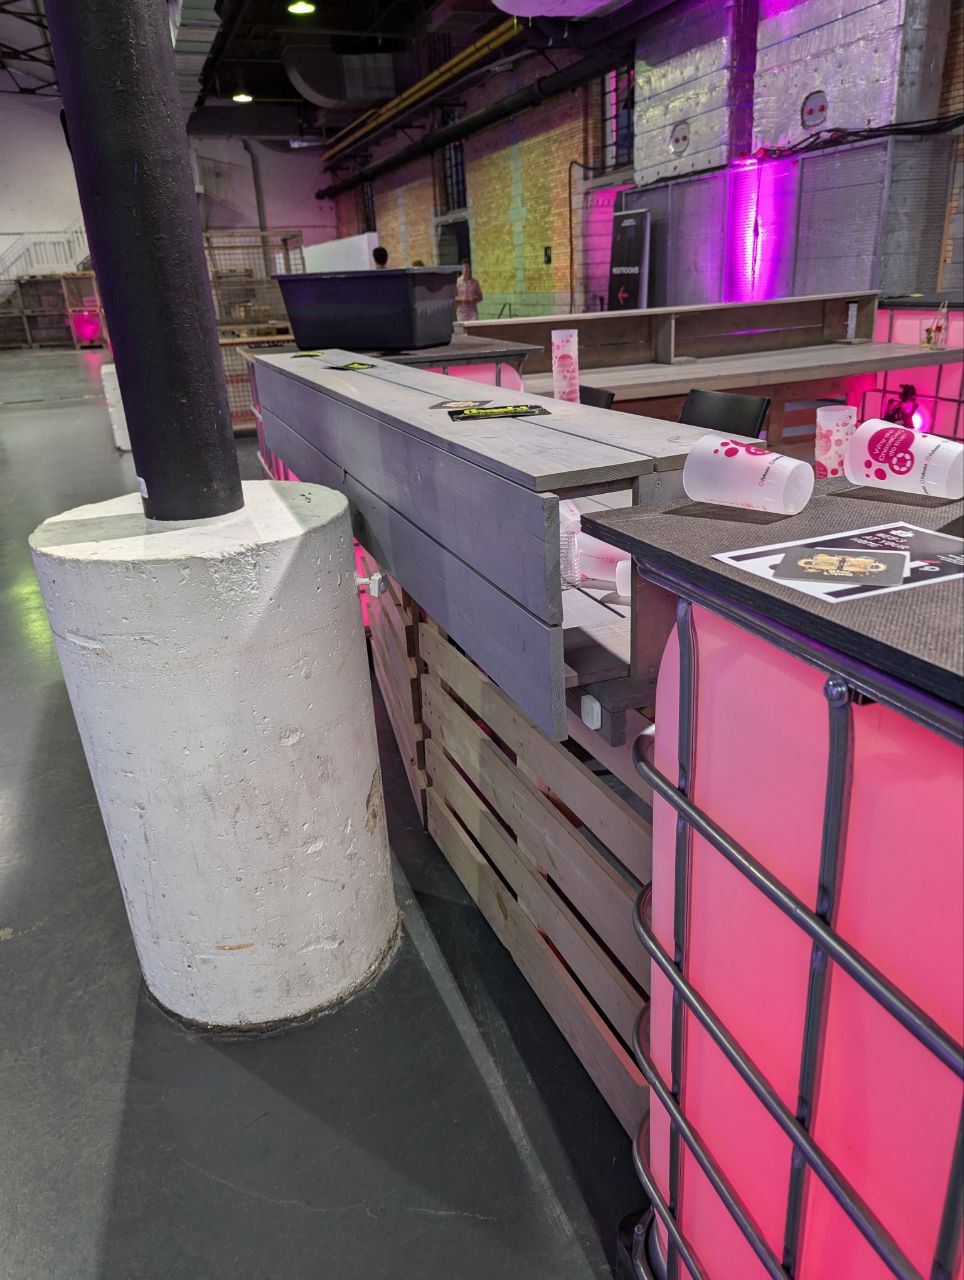
Several more temperature sensors were placed inside the bar counter and at the coffespot which was nearby.
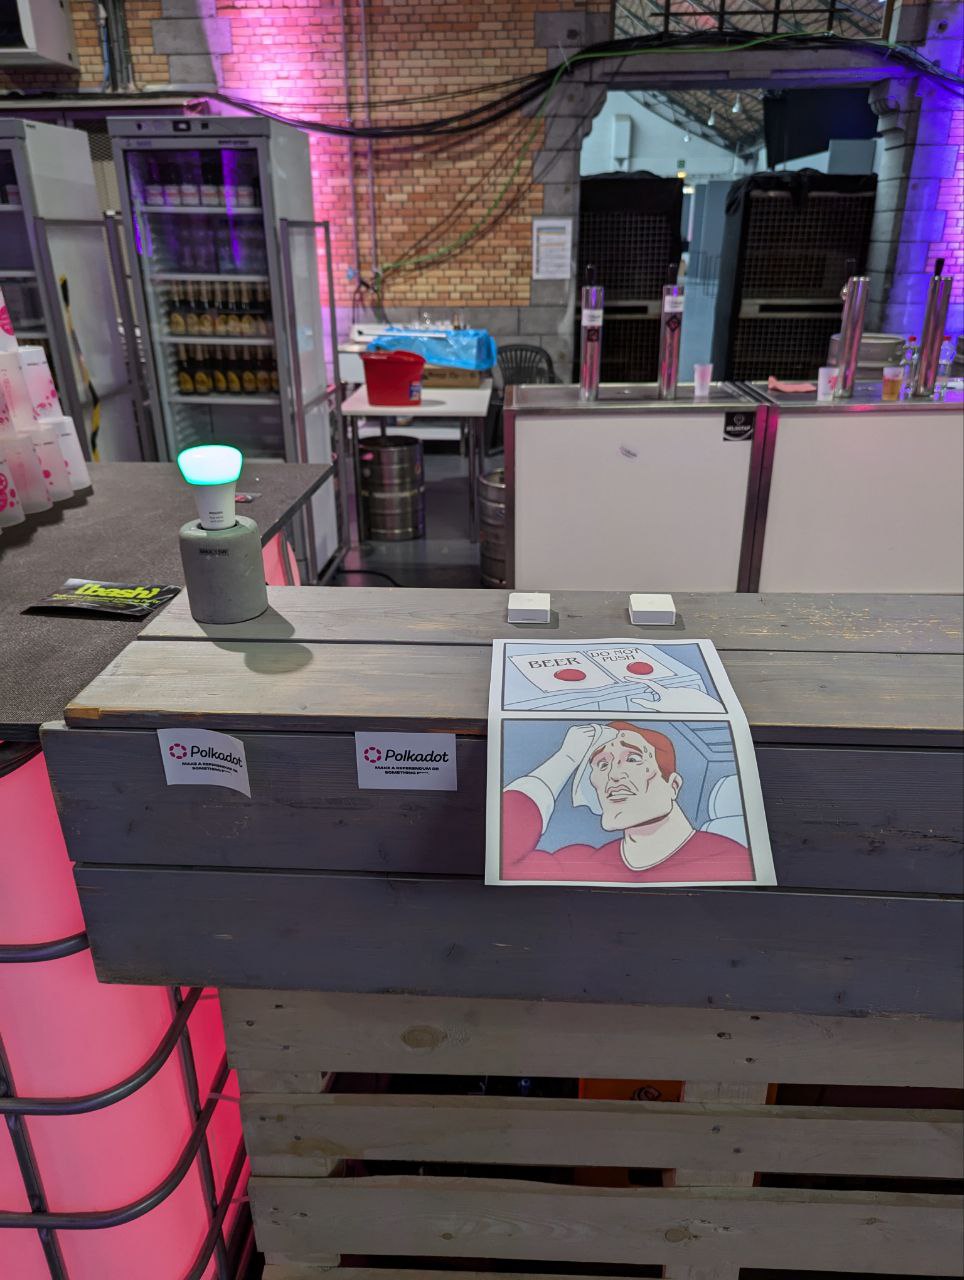
A beer meme-counter was also installed, which would light up green for 5 seconds if the “Beer” button was pressed, or red if the “do not press” button was pressed:
Data Obtained
Disclaimer: In this section, all data will be shown in the Home Assistant interface for convenient visualization. This same data can be obtained from the Robonomics parachain and compared. Instructions are to be provided later.
Study period: For the study period, we will take the time from 16:00 on July 11 to 20:00 on July 12, which corresponds to half of the first day of Decoded and the entire second day.
It is also important to clarify that the bar opened at 12 noon, which also limits the measurable interval.
Temperature and Humidity
First day (July 11) - as can be seen from the graphs, a comfortable temperature of 25-27 degrees was maintained indoors.
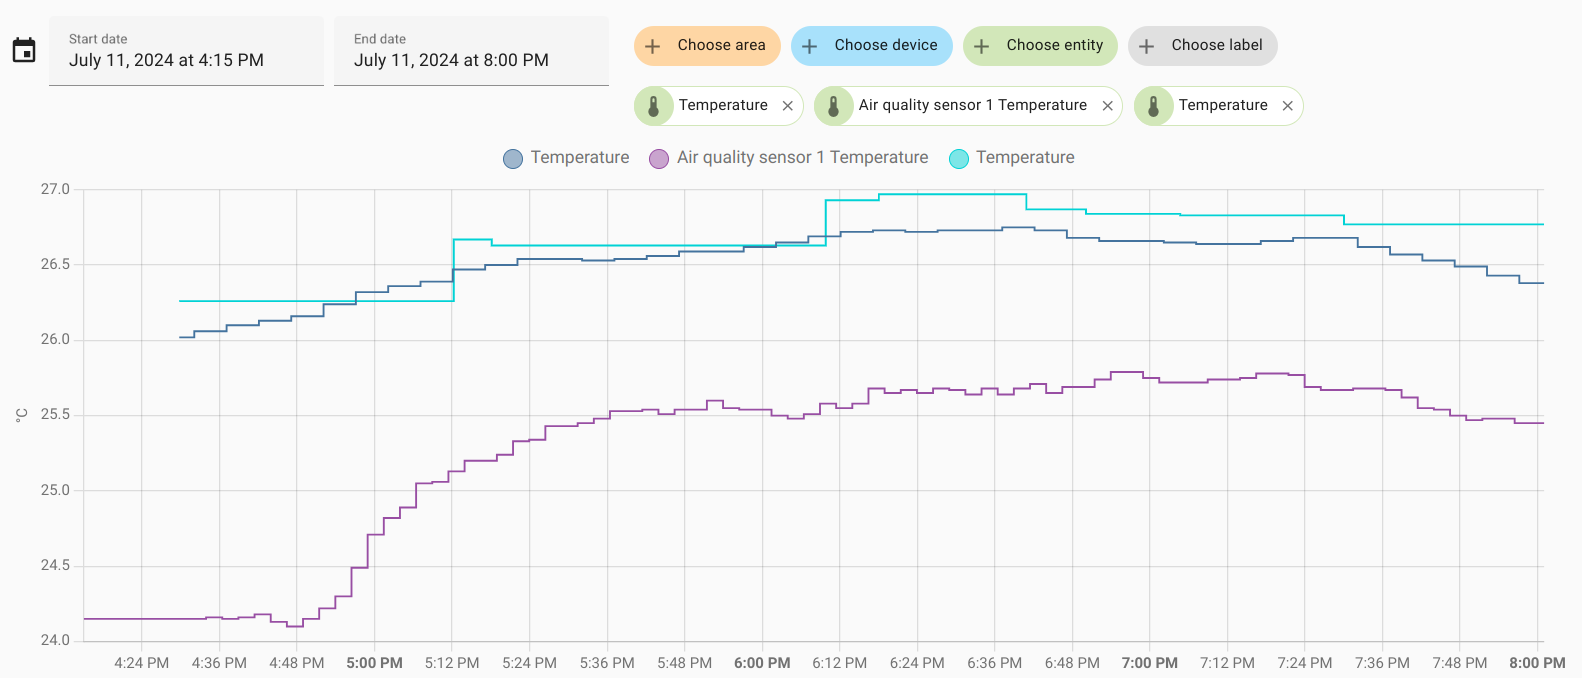
Second day (July 12) - the temperature dropped by a few degrees but remained comfortable.
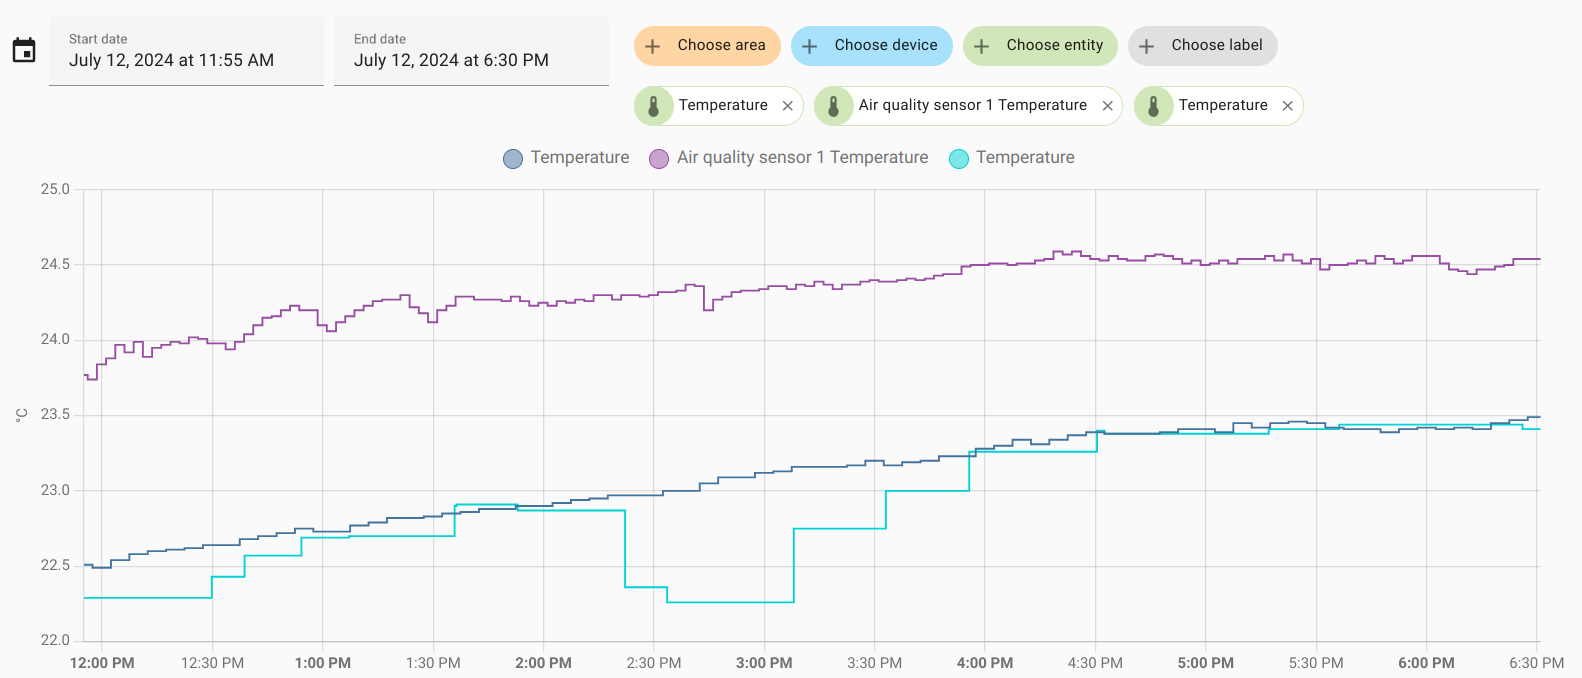
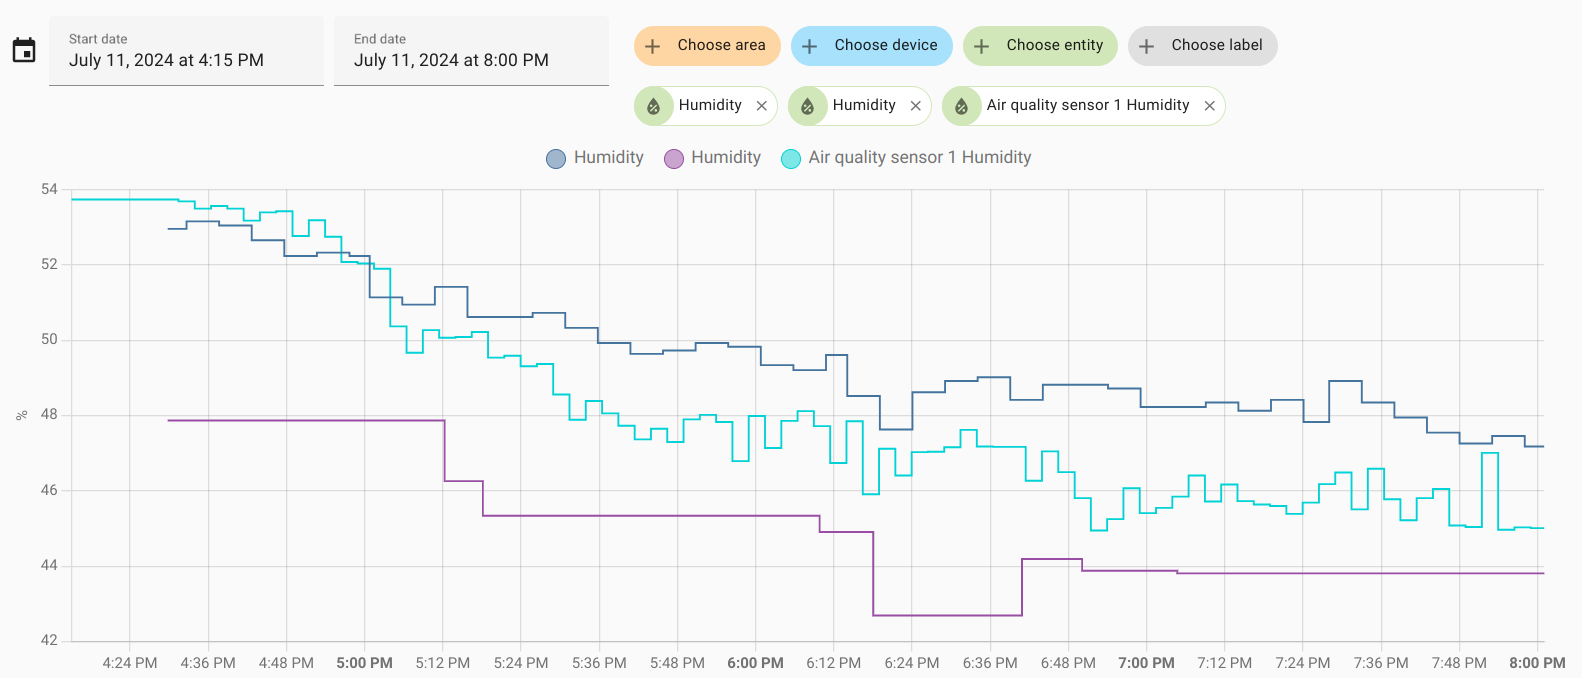
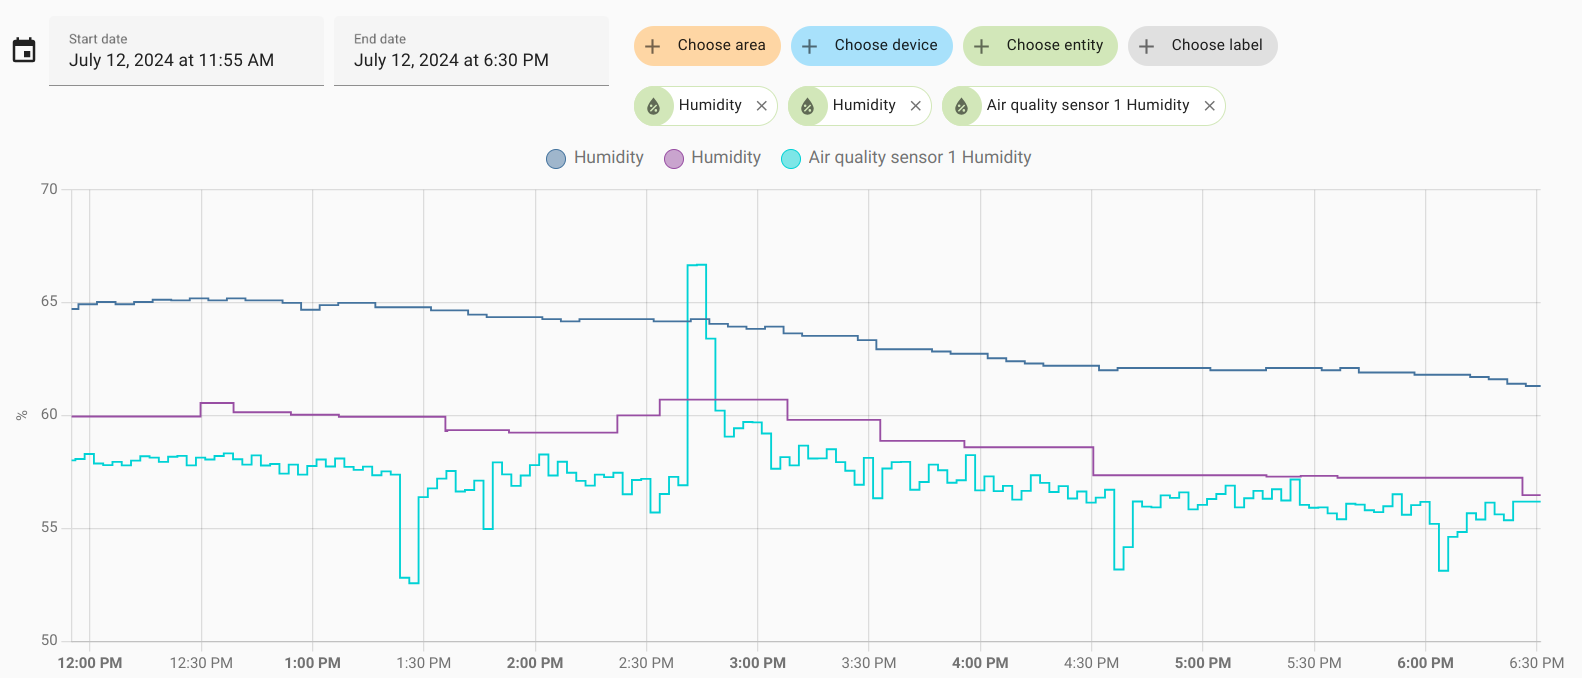
The temperature drop is related to the rain on the second day, which is clearly visible on the humidity graphs. Humidity increased by 10-15%. First day:
Second day:
Motion Sensors
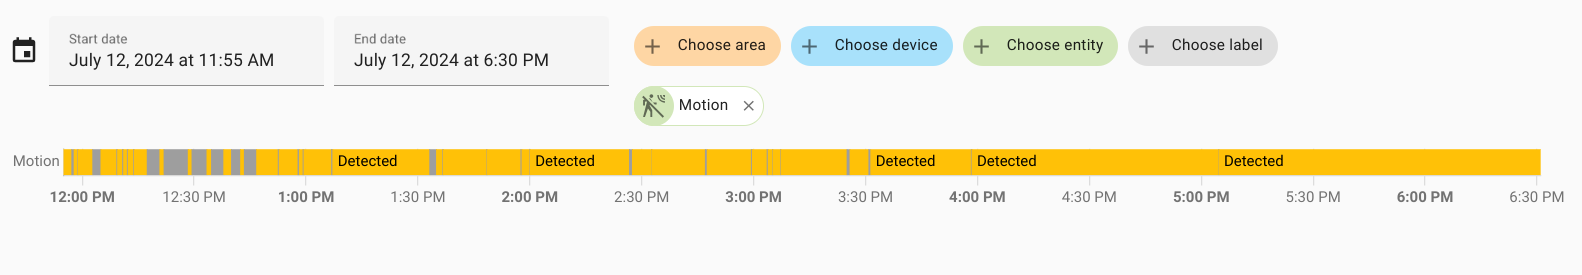
Yellow indicates the time when someone was near the bar, gray - when there were no people. Motion sensor at the bar - first day:
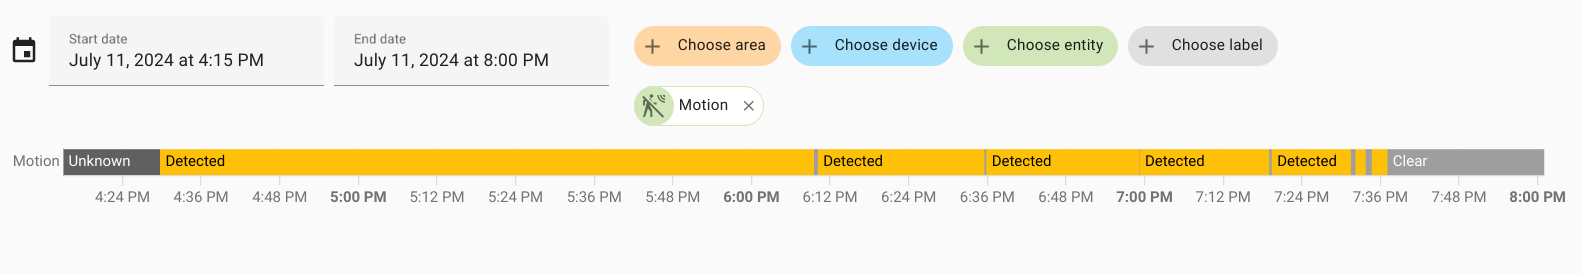
Second day:
And PlayStation area - first day:
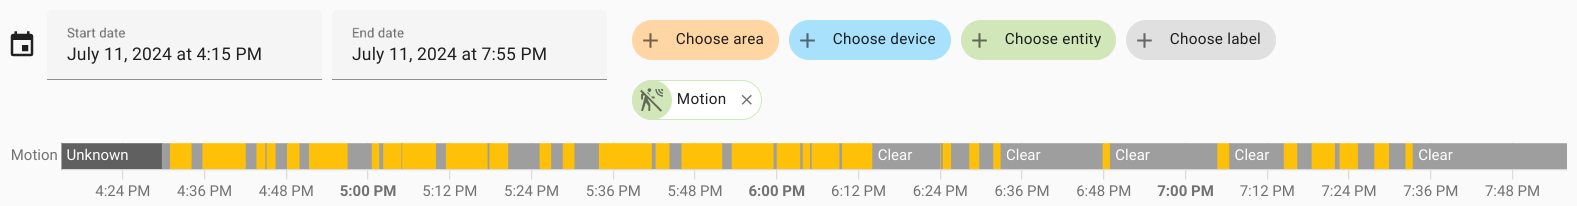
Second day:
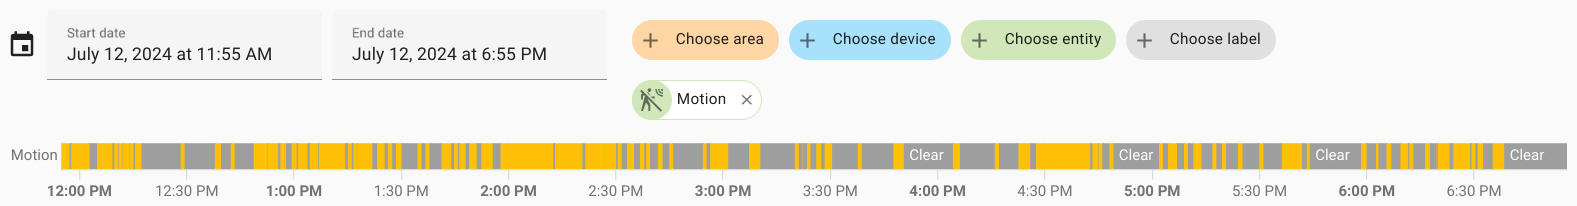
From the sensors, we can see that almost all the time the bar was opened, someone was standing at the counter. Also, almost half the time, someone was playing on the PlayStation.
Door sensors
Great, we’ve looked at the general indicators around the bar, now let’s try to get some numbers. For this, we have door sensors. There were 2 refrigerators. On the example of one of them, let’s see how to count the number of openings.
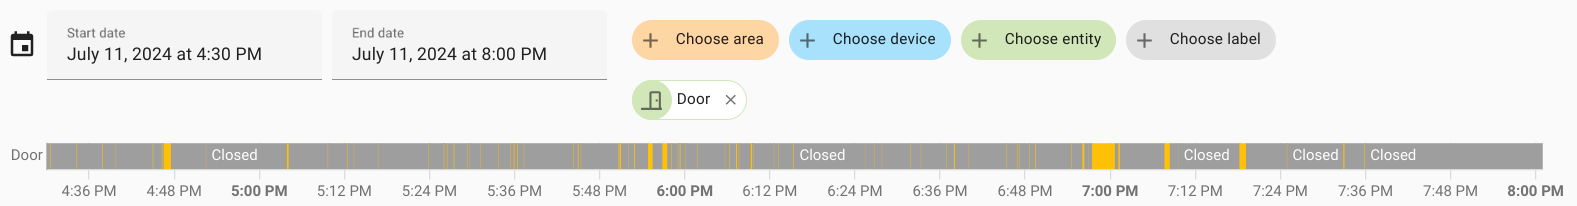
Of course, you could count the number of yellow stripes on this graph, which are the moments when the door was opened. But you can export this to a csv file and get the following:
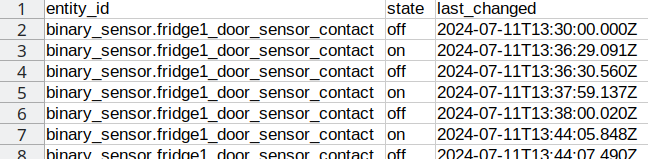
Here, each individual row shows the time of the sensor state change. So, by simply dividing the number of rows in half, you can get the number of refrigerator openings. As a result, we get the following table:
| fridge 1 | fridge2 | |
|---|---|---|
| First day | 76 | 78 |
| Second day | 111 | 87 |
| summary | 187 | 165 |
A total of 352 refrigerator openings. And we can confidently say that this is the lower bound of the number of beer/water bottles that were taken over two days, as multiple bottles could be taken at one door opening.
Beer meme-counter
And lastly, the beer meme-counter. It was installed only on the second day. There were 2 buttons, one labeled “Beer” and the other “Do not press”. How many times was each button pressed?
| Beer | Do not press |
|---|---|
| 83 | 44 |
As you can see, about 2/3 of the people chose the right button.
Data Verification
Let’s move on to obtaining this data from the blockchain. All data is stored in the datalogs of this account - “4EsopMUbxQH5NseBXiJcPkTy5ZRhs7XrjuMBqmoCzBqWQ9gB”. Let’s open it in Subscan.
We will see all its extrinsics. Let’s filter them by date. We will get about 140 extrinsics.
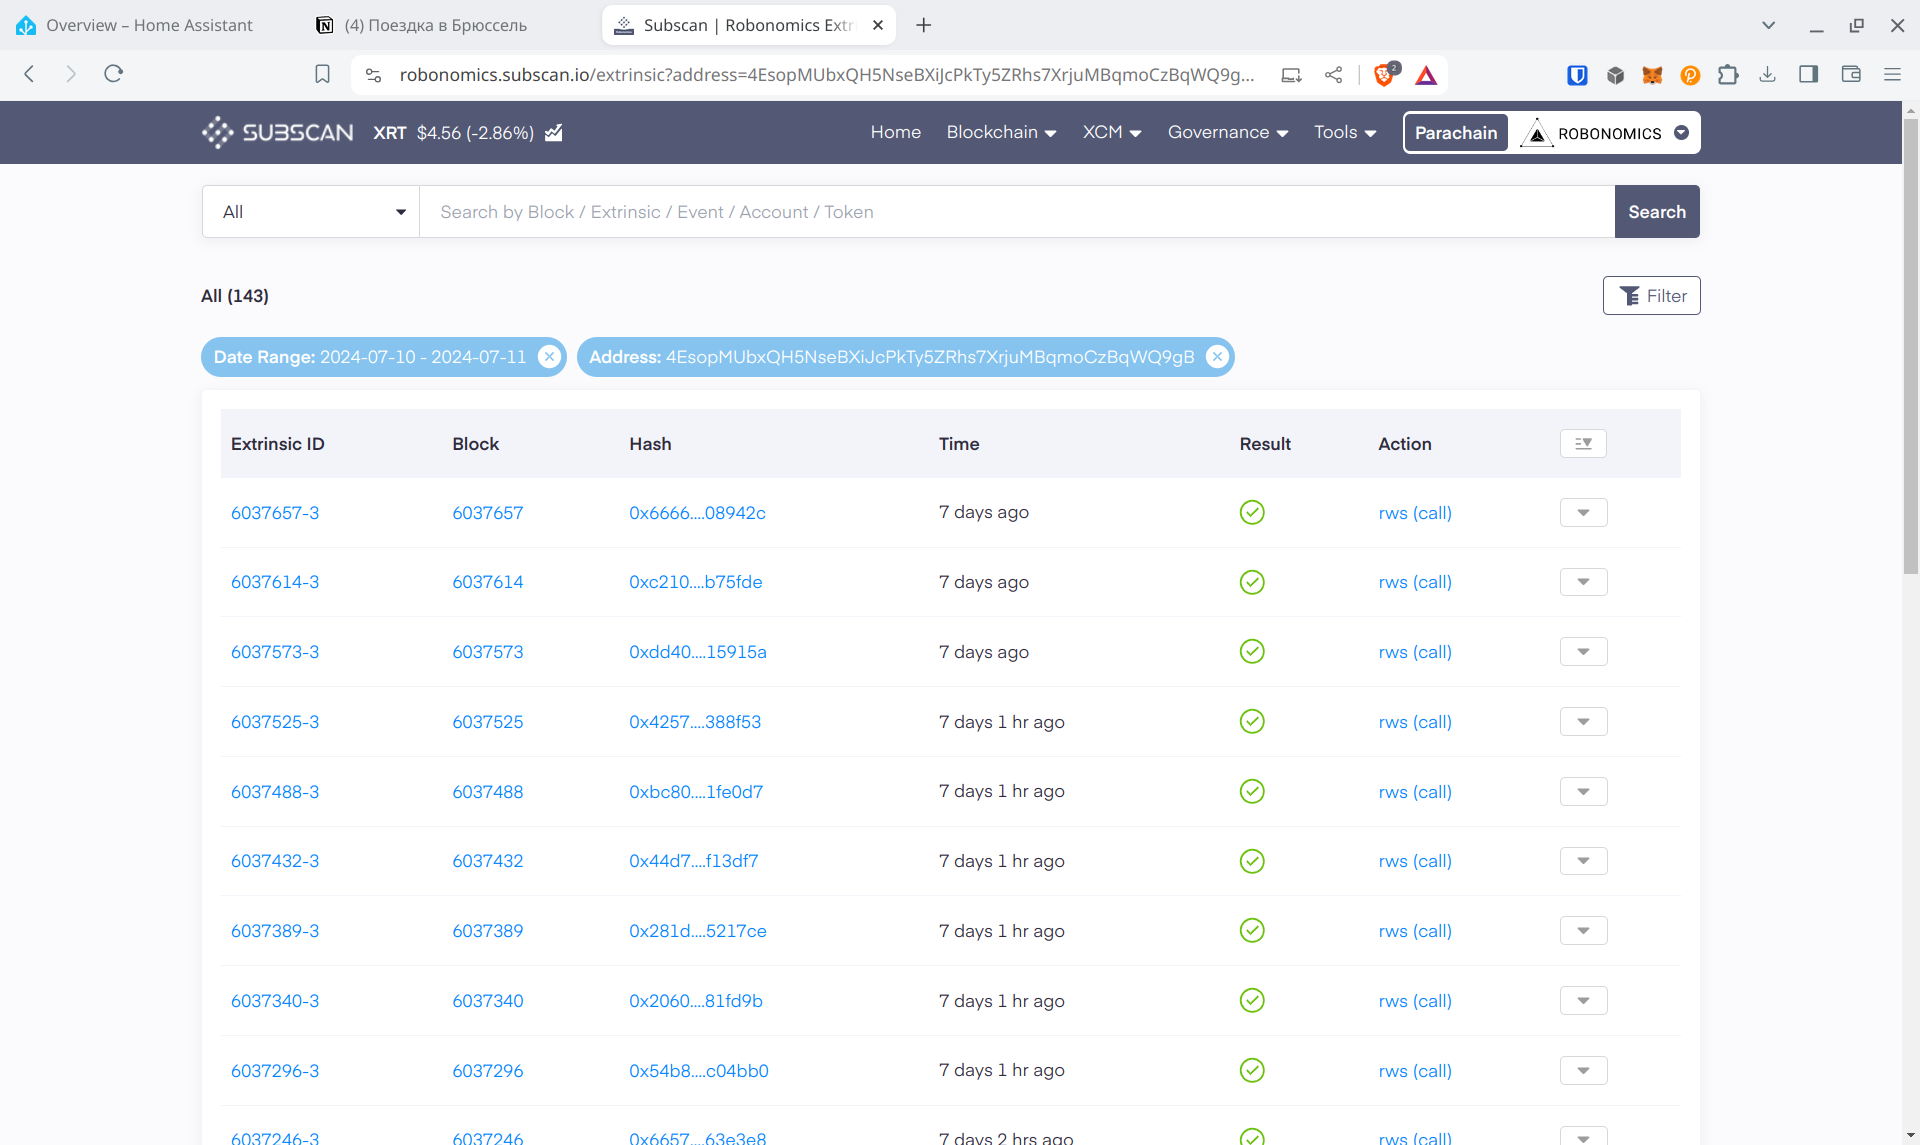
Each of them contains an IPFS CID with telemetry. Let’s take any extrinsic and extract the data from it.
For example, this one.
IPFS CID inside it - QmZMkJo6StbfDVvGCqVnV3sZeG7R3cftt7WXfdUVdpJ4c3.
Then all you need to do is use this script to decrypt the data. Replace the IPFS CID in line 11 with the one you need:
import requests
from substrateinterface import Keypair, KeypairType
from robonomicsinterface import Account
import typing as tp
import json
import os

ADMIN_SEED="client teach develop blush just ginger depart sister orange rather measure park"
IPFS_HASH="QmZMkJo6StbfDVvGCqVnV3sZeG7R3cftt7WXfdUVdpJ4c3"

def decrypt_message(data: tp.Union[str, dict]) -> str:

    """Decrypt message that was encrypted fo devices
    :param data: Ancrypted data
    :param sender_address: Sender address
    :param recipient_keypair: Recepient account keypair

    :return: Decrypted message
    """
    try:
        account = Account(ADMIN_SEED, crypto_type=KeypairType.ED25519)
        admin_keypair = account.keypair
        print(account.get_address())
        sender_public_key = admin_keypair.public_key
        if isinstance(data, str):
            data_json = json.loads(data)
        else:
            data
        if admin_keypair.ss58_address in data_json:
            decrypted_seed = _decrypt_message(
                data_json[admin_keypair.ss58_address],
                sender_public_key,
                admin_keypair,
            ).decode("utf-8")
            decrypted_acc = Account(decrypted_seed, crypto_type=KeypairType.ED25519)
            decrypted_data = _decrypt_message(data_json["data"], sender_public_key, decrypted_acc.keypair).decode(
                "utf-8"
            )
            return decrypted_data
        else:
            print(f"Error in decrypt for devices: account is not in devices")
    except Exception as e:
        print(e)

def _decrypt_message(encrypted_message: str, sender_public_key: bytes, admin_keypair) -> str:
    """Decrypt message with recepient private key and sender puplic key
    :param encrypted_message: Message to decrypt
    :param sender_public_key: Sender public key

    :return: Decrypted message
    """
    if encrypted_message[:2] == "0x":
        encrypted_message = encrypted_message[2:]
    bytes_encrypted = bytes.fromhex(encrypted_message)
    return admin_keypair.decrypt_message(bytes_encrypted, sender_public_key)

def main():
    account = Account(ADMIN_SEED, crypto_type=KeypairType.ED25519)
    admin_keypair = account.keypair
    response = requests.get(f"<https://gateway.pinata.cloud/ipfs/{IPFS_HASH}>")
    print(response)
    with open("telemetry.txt", "w") as f:
        decrypted_content = decrypt_message(response.text)
        print(decrypted_content)
        f.write(decrypted_content)

if __name__ == "__main__":
    main()
As a result, you will get a “telemetry.txt” file with json inside. It will contain all the same data we reviewed above. You will just need to parse it.
Conclusions
Thanks to all these indicators, we can say that the idea of “free beer” from ChaosDAO was successful, and people actively used it, even though some the beer didn’t run out. And thanks to the sensors and the Robonomics team, you can see quantitative and qualitative indicators of this event with data saved in the Kusama network.